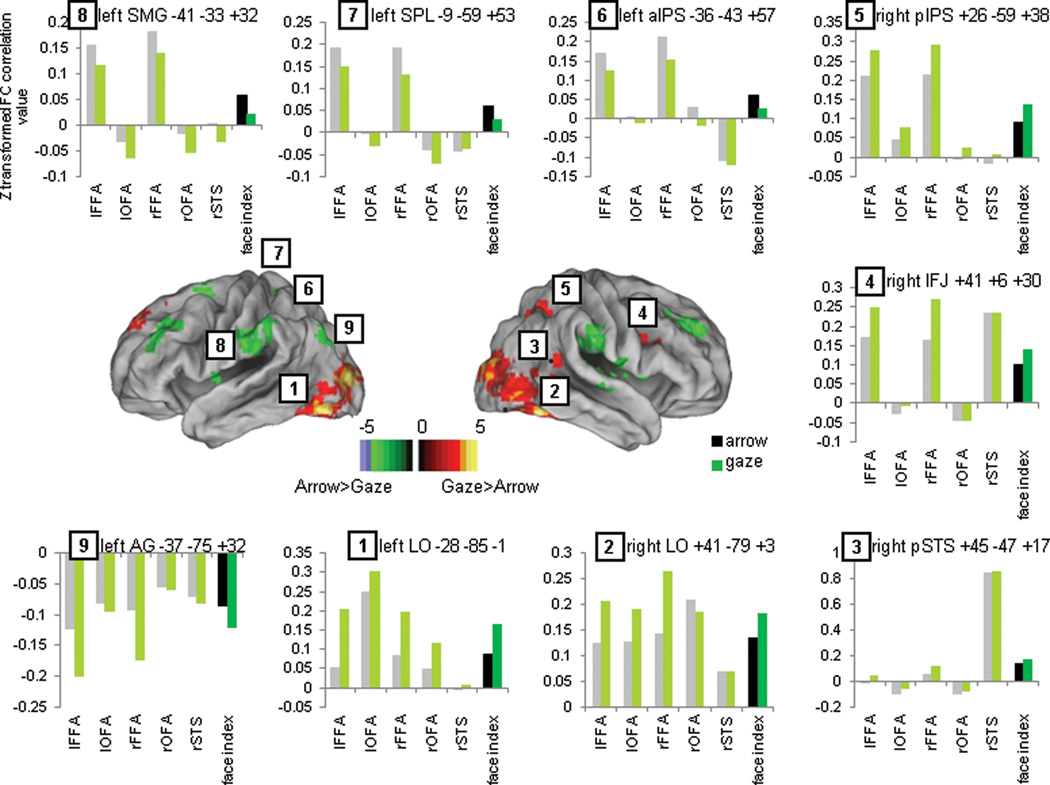
Figure 5.
Voxelwise map of statistical differences between the face network functional connectivity voxel-wise map during social and symbolic trials (warm colors represent areas where the face network shows stronger positive connectivity or weaker negative connectivity during social trials and cold colors represent areas where the face network shows stronger positive connectivity or weaker negative connectivity during symbolic trials) and bar plots showing the connectivity strength between the face network (dark green and black bars) or each individual face seed (light green and gray bars) and some representative peak regions.

