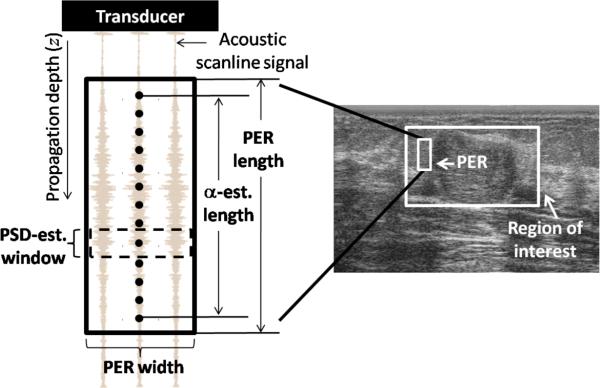
Fig. 1.
Description of a parameter estimation region (PER) from which one estimate of the attenuation coefficient is obtained. Each power spectral density (PSD) estimate is assigned to the center of the spectral estimation window, indicated by a dot. The PER width is defined by the number of adjacent scanlines it includes, and its length is defined by the α-estimation length plus one spectral estimation window length. The abbreviation “est.” stands for “estimation”.

