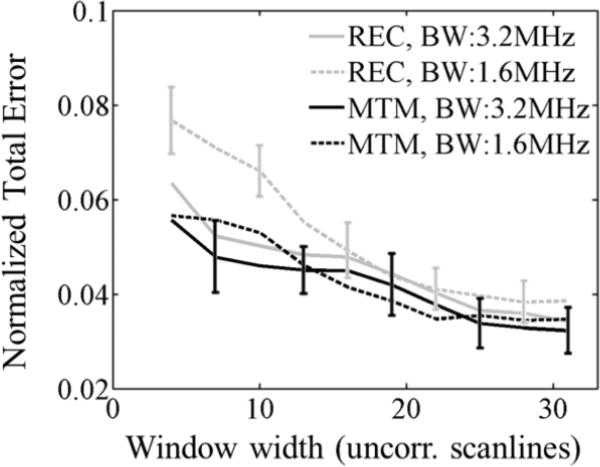
Fig. 11.
Normalized fit error of the power-law fit applied to αsample(f) with respect to the laboratory-estimated power-law model vs. the spectral estimation window width expressed in the number of uncorrelated acoustic scanlines, with a fixed window length of 10 pulse-echo correlation lengths (PECLs) and α-estimation length of 33 PECLs . Each curve corresponds to the use of the short-time Fourier transform with a rectangular taper (REC) or Thomson's multitaper method (MTM) methods under different bandwidths (3.2 MHz and 1.6 MHz). Error estimates were averaged across 20 frames. Error bars are shown only for REC (1.6MHz bandwidth) and MTM (3.2MHz bandwidth) at alternate window widths for easier visualization.

