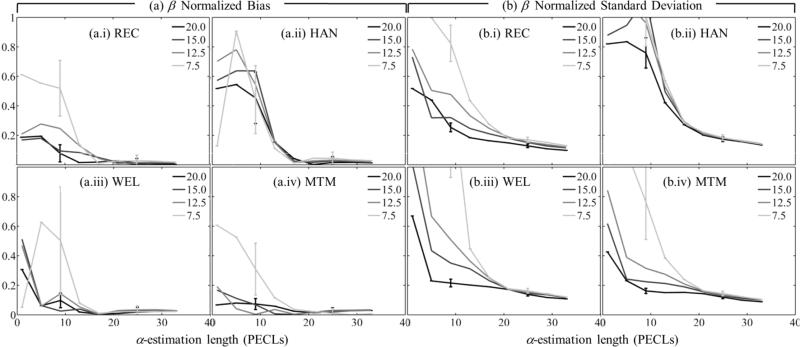
Fig. 7.
(a) Normalized bias and (b) normalized standard deviation of the estimates of β vs. the α-estimation length. Each curve corresponds to a different spectral estimation window length, but a fixed width of 22 uncorrelated acoustic scanlines. Subfigures in (a) and (b) are for different spectral estimators: (i) Short-time Fourier transform with rectangular taper (REC), (ii) short-time Fourier transform with Hann taper (HAN), (iii) Welch's method (WEL), (iv) Thomson's multitaper method (MTM). Estimates were averaged across 20 frames.

