Fig. 4.
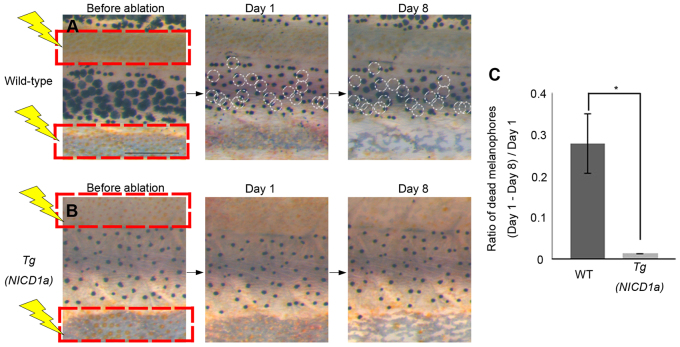
Melanophore survival is independent of xanthophores in Tg(mitfa:NICD1a) transgenic fish. (A,B) Effects on melanophores after ablation of xanthophores is shown for wild type (A) and Tg(mitfa:NICD1a) (B). Red squares indicate the areas in which xanthophores were ablated. White circles indicate melanophores present on day 1 but lost by day 8. (C) Proportion of melanophores that died in wild-type and Tg(mitfa:NICD1a) fish (n=5, respectively). *P<0.0001 (Student’s t-test). Error bars represent s.d. Scale bar: 500 μm.

