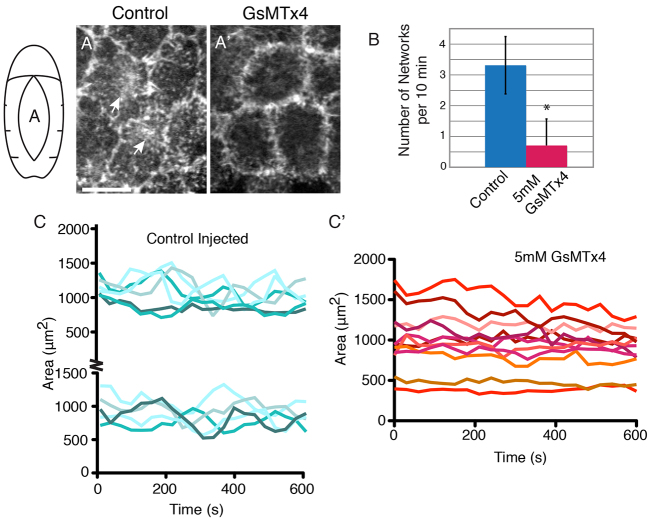
Fig. 3.
MGC inhibition interferes with F-actin localization and dynamics. (A,A′) Control injected sGMCA embryos exhibit apical actin networks (A, arrows), which are inhibited by 5 mM GsMTx4 (A′). Both images are z-projections. (B) Quantification of actin network formation in control (n=4 embryos, 32 cells) or 5 mM GsMTx4 (n=4 embryos, 40 cells) conditions. *P<0.0001 (t-test). Error bars indicate s.d. (C) Representative data from oscillating AS cells in control injected sGMCA embryos (presented in two panels for clarity). (C′) Representative data from AS cells in 5 mM GsMTx4-injected embryos. Scale bar: 10 μm.

