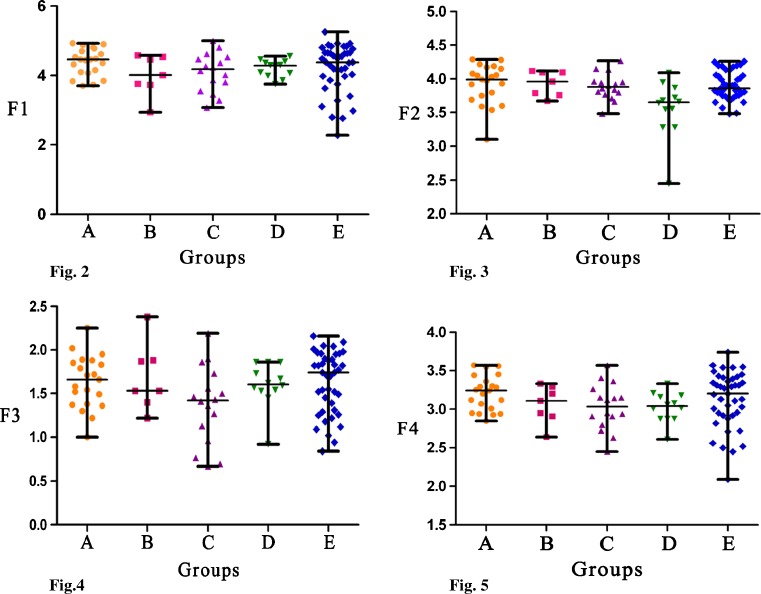
Figs. 2–5.
Shown that there were no differences in F1, F3, and F4 between five groups. Figure 3 shown that F2 of D group was significantly lower when respectively comparing with A group, B group, C group and E group (P < 0.05). A group: occupational exposure group (n = 21), B group: Smoking group (n = 7), C group: Drinking group (n = 16), D group: occupational + smoking + drinking group (n = 12), E group: non-exposure group (n = 41). F1: The first principle component in occupation, F2: The second principle component in occupation, F3: The third principle component, F4: Semen quality

