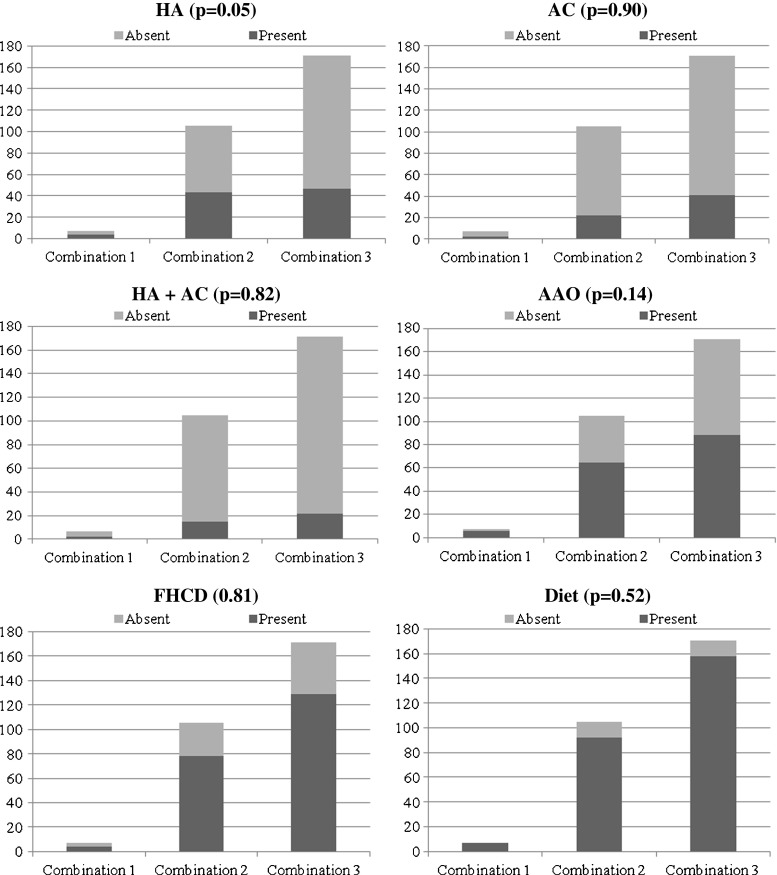
Fig. 3.
Analysis of haplotype combinations with different clinical and epidemiological factors. Note: Each bar compares the distribution of TNF-α combinations with respect to presence or absence of a specific trait. HA—Hyperandrogenism, AC—Acanthosis, AAO—Age at onset, FHCD—Family history of complex diseases

