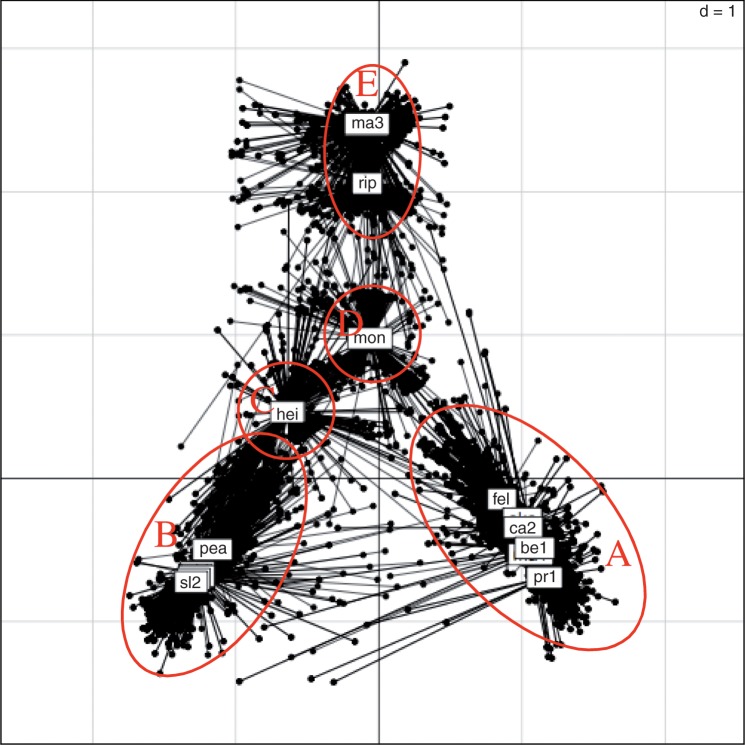
Fig. 3.—
Cohesion plot for every gene tree, showing the consensus typology estimated by Phylo-MCOA. For each species, lines represent the distance between its reference position (squares) and its position in each individual tree. Long lines represent species which position in a given tree is not concordant with its reference position.

