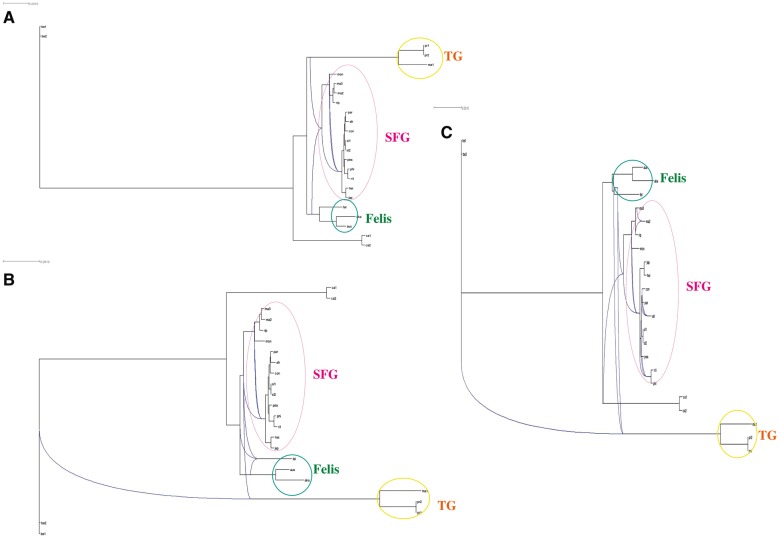
Fig. 5.—
Galled rooted hybridization networks displaying putative recombination events that reconcile the differences between the 606 individual core gene trees. Decreasing thresholds for network construction reveal increasing numbers of recombination events. Networks display clusters present in at least (A) 20%, (B) 15%, and (C) 10% of the gene trees.

