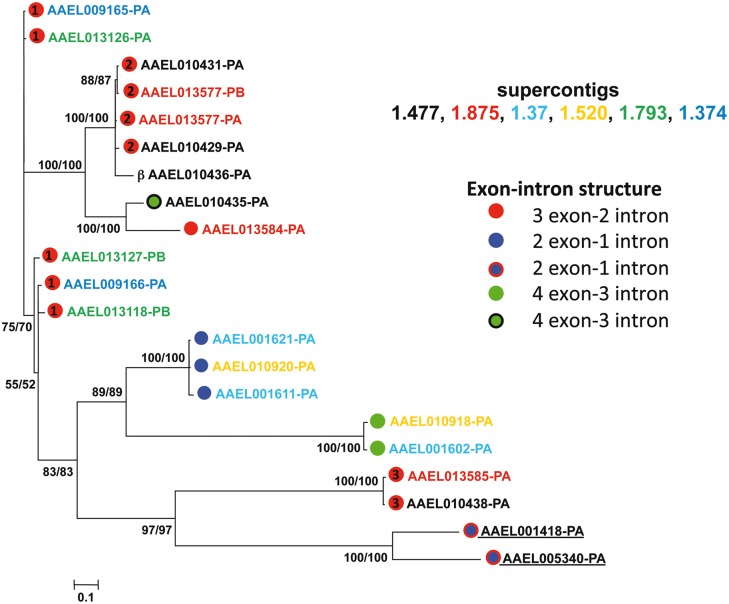
Fig. 2.—
Phylogeny of the SDMA genes of Aedes aegypti. Names of genes are color-coded based on the clustering observed in the A. aegypti genome assembly at the supercontig level depicted in figure 5. Dots next to gene names denote exon–intron structure with numbering within the red dots corresponding to the grouping of the exon–intron structures as shown in supplementary figure S1, Supplementary Material online. Numbers at each of the nodes represent posterior probabilities from the two separate runs of the tree.

