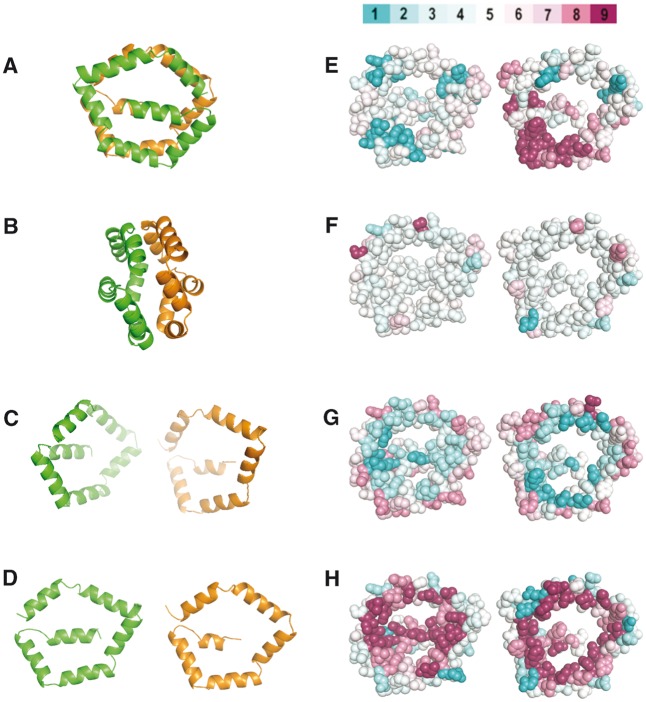
Fig. 4.—
Introduction to the Bla g 1 structure and SMDA residue propensities. (A–D) Ribbon diagram of Bla g 1 (4JRB) where α is colored orange and β is colored green. The structure in B is rotated 90° with respect to A. Panels C and D simulate in silico opening up of the two halves. D–H are oriented with the interior of the protein facing the viewer. (E–H) Bla g 1 rendered as spheres color coded by the degree of sequence conservation (E, high conservation magenta), secondary structure propensity (F, high helical propensity magenta), hydrophobicity (G, more hydrophobic residues are cyan), and residue polarity (H, more polar residues are cyan). The scores are the average at each position for a clustlw alignment of SDMAs. The color scale is shown above panel E. The color scale was adapted from CONSURF (Celniker et al. 2013).

