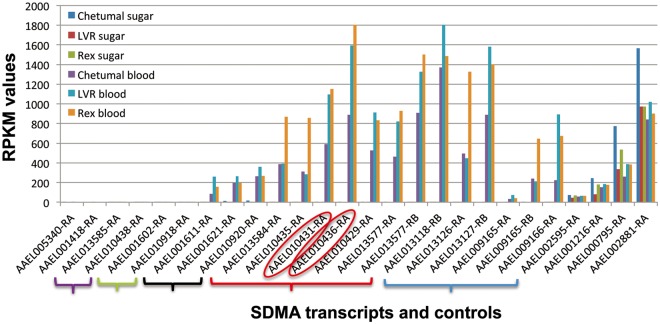
Fig. 6.—
RNAseq analyses of expression of SDMA genes in Aedes aegypti females of three strains. Three strains of A. aegypti were sugar fed or blood fed. RPKM (fragments per kb per million reads) values for each SMDA homolog are shown on the y axis, and for those genes with multiple isoforms, only the most abundant isoform is shown. SDMA genes are organized by the evolutionary relatedness described in figure 2. AAEL010436 (β monomer) and AAEL010429 (AEG12) are highlighted. Control genes (AAEL002595, AAEL001216, AAEL000795, and AAEL002881) representing different RPKM levels are shown at right; none of the differences between the feeding conditions or strains are statistically significant in these controls. The data are collated from Bonizzoni et al. (2012).

