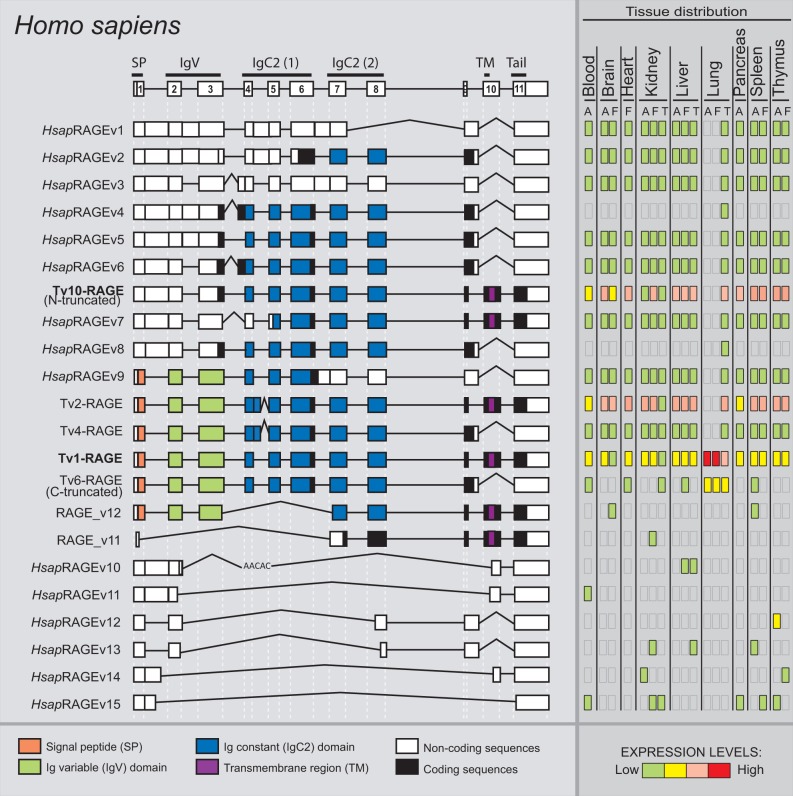
Fig. 1.—
RAGE transcript variants in Homo sapiens. Representation of human RAGE splice variants and their relative expression levels in different adult (A), fetal (F), and tumor (T) tissues. Potential protein domains are shown with different colors, and noncoding sequences are shown in white. Junctions from the canonical variant are shown as straight lines, whereas the alternative junctions are shown as open triangles. Splice variants are arranged by length.

