
Fig. 2.—
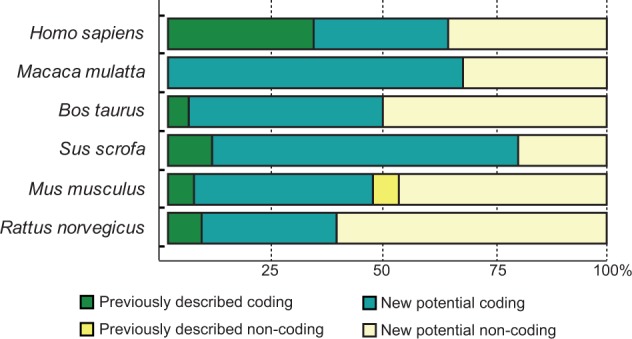
Relative abundance of coding versus noncoding transcript analyzed. Stacked percentage bars reflect the portion of previously described variants and the variants that we found in our study (coding and noncoding) present in different analyzed species.