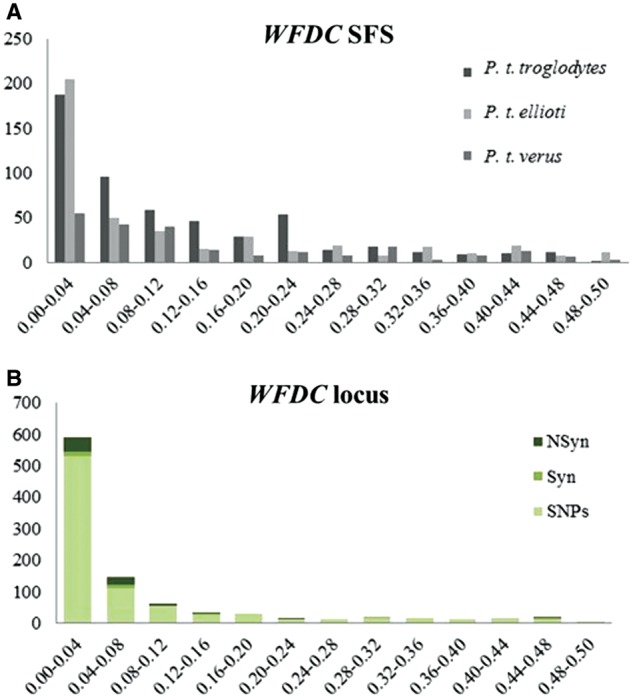
Fig. 3.—

Folded SFS for the species that were resequenced. The x axis depicts the frequency of the allele frequency bin in the generated data set, whereas the y axis represents the number of alleles found within each frequency bin. Syn, synonymous changes; NSyn, nonsynonymous changes. (A) Folded SFS in WFDC locus; (B) folded SFS of WFDC locus highlighting coding mutations.
