
Fig. 5.—
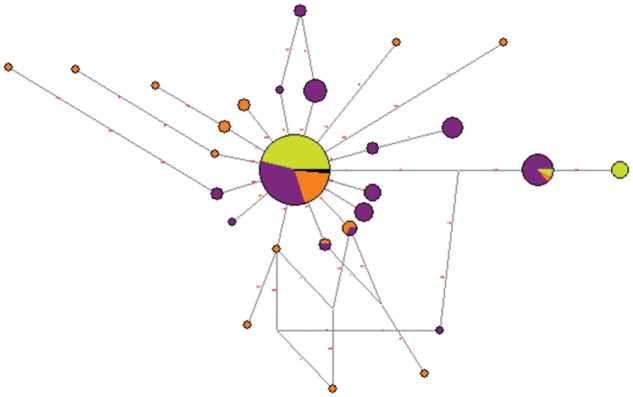
Inferred haplotype network at the WFDC6. Each circle represents a unique haplotype, and its area is proportional to its frequency. Within each circle, Pan troglodytes verus, P. t. ellioti, and P. t. troglodytes are labeled in green, purple, and orange, respectively. The mutations that differentiate each haplotype are shown along each branch.