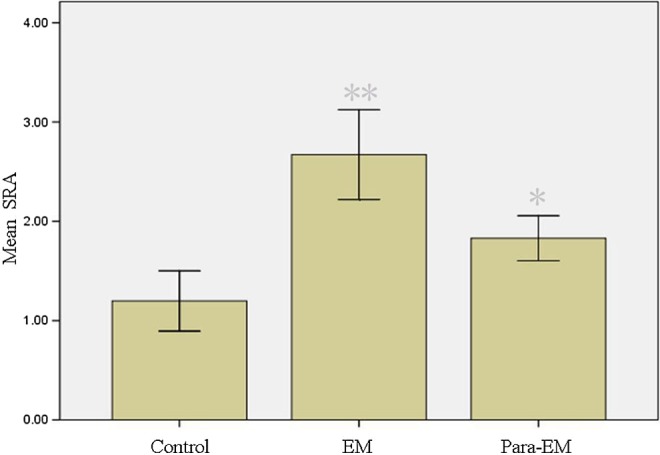
Figure 1.

Real-time PCR analysis of SRA in different tissues. The relative level of expression is calculated by 2−ΔΔCt. Mean values indicated SRA expressions. Columns indicate data from separate experiments; bars indicate SD. *P < .05 versus control; **P < .05 versus control and versus *, respectively (Student t test); control, ovarian tissue surrounding mature teratoma; EM, ovarian endometrioma; Para-EM, ovarian tissue surrounding ovarian endometrioma; PCR, polymerase chain reaction; SD, standard deviation; SRA, steroid receptor RNA activator.
