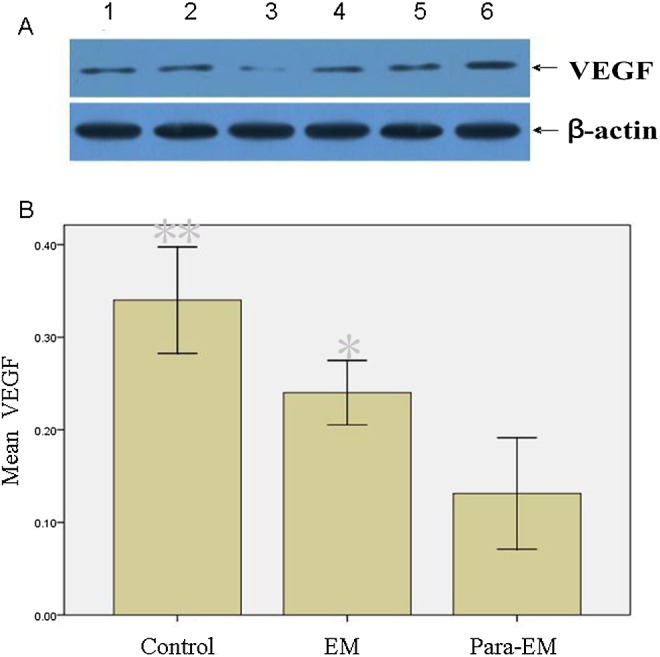
Figure 3.

Western blot analysis of VEGF in different tissues. A, Lanes 1 and 2, ovarian endometrioma; lanes 3 and 4, surrounding ovarian tissues; lanes 5 and 6 ovarian tissues surrounding mature teratoma served as the controls. β-Actin expression is shown as the loading control. Normalized values indicated the ratios of 1 protein and β-actin protein expression. B, Mean values indicated VEGF expression. Columns indicate data from separate experiments; bars indicate SD. *P < .05 versus control; ** P < .05 versus control and versus *, respectively (Student t test); control, ovarian tissue surrounding mature teratoma; EM, ovarian endometrioma; Para-EM, ovarian tissue surrounding ovarian endometrioma; SD, standard deviation; VEGF, vascular endothelial growth factor.
