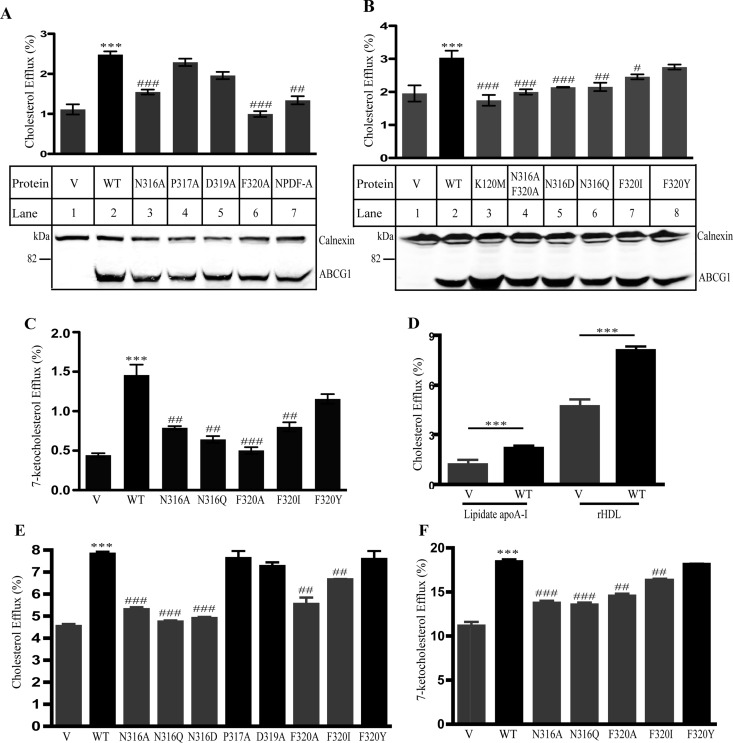
Figure 2.
Effects of individual residues within the conserved sequence on ABCG1-mediated cellular cholesterol efflux. Panels A and B: Cholesterol efflux to lipidated apoA-I. The experiments were carried out as described in Figure 1C. Samples tested are indicated in the figures. Values are mean ± SD of at least 3 independent experiments. The bottom figures in Panels A and B were representative figures showing protein levels. Expression of wild type and mutant ABCG1 in HEK293 cells transiently overexpressing wild type and mutant ABCG1 was determined as described in Figure 1B except that ABCG1 was detected with a polyclonal anti-ABCG1 antibody, 4497. Calnexin was detected with a mouse monoclonal anticalnexin antibody. Antibody binding was detected using IRDye-labeled goat antimouse or antirabbit IgG (Li-Cor). The signals were detected by a Licor Odyssey Infrared Imaging System. Panel C: 7-ketocholesterol efflux to lipidated apoA-I. The experiment was performed as described in the legend to Figure 1C except that the cells were labeled with [3H]7-ketocholesterol. Panel D: Cholesterol efflux to lipidated apoA-I or rHDL. The experiment was performed as described in the legend to Figure 1C. V: control cells. WT: wild type ABCG1-expressing cells. Panels E and F: Cholesterol and 7-ketocholesterol efflux to rHDL. The experiment was performed as described in the legend to Panels A and B except that the acceptor used was rHDL (5 μg/mL). Values are mean ± SD of one experiment that was performed in triplicate. * or # indicates p < 0.05; ** or ## indicates p < 0.01; *** or ### indicates p < 0.001. *Compared with the control cells that were transiently transfected with empty vector (V). #Compared with wild type ABCG1-expressing cells (WT). Similar results were obtained from at least one more independent experiment.

