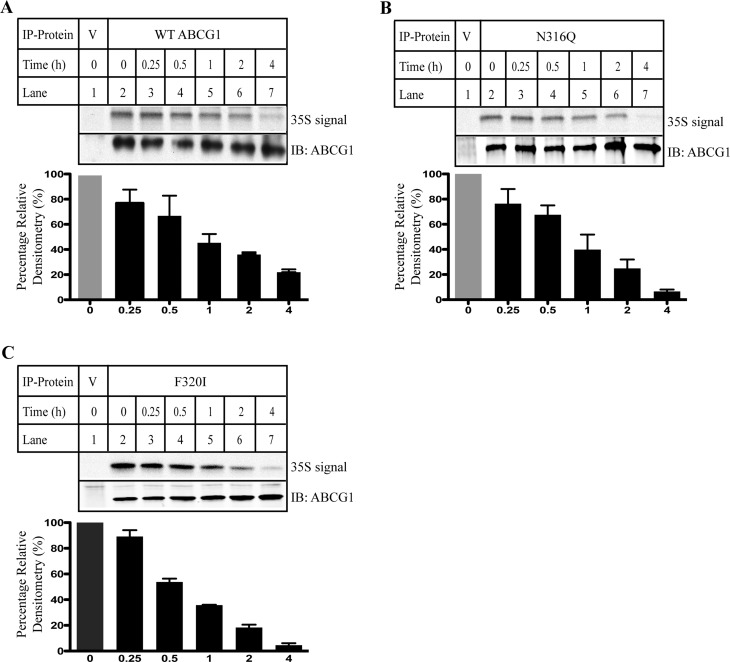
Figure 3.
Metabolic labeling of cells with 35S Cys/Met. The experiments were performed as described in Materials and Methods. Briefly, HEK293 cells stably expressing wild type ABCG1 or mutant N316Q or F320I were metabolically labeled with [35S]-Met/Cys (100 μCi/ml). ABCG1 was immunoprecipitated from same quantities of total proteins and then subjected to SDS-PAGE (8%). ABCG1 protein was detected by immunoblotting with a polyclonal anti-ABCG1 antibody, 4497. 35S signal was detected by X-ray film exposure. Similar results were obtained from two more independent experiments. Top figures in each panel were representative figures showing 35S signal levels and ABCG1 protein levels. Bottom figures in each panel were relative densitometry. The densitometry was determined using Image J Analysis Software. The relative densitometry was the ratio of the densitometry of 35S signal to that of ABCG1 protein signal at the same time point. Percentage of relative densitometry was the ratio of the relative densitometry of ABCG1 at different time points to that of ABCG1 at time 0. Values are mean ± SD of three independent experiments. The percentage of relative densitometry of ABCG1 at time 0 was defined as 100%.

