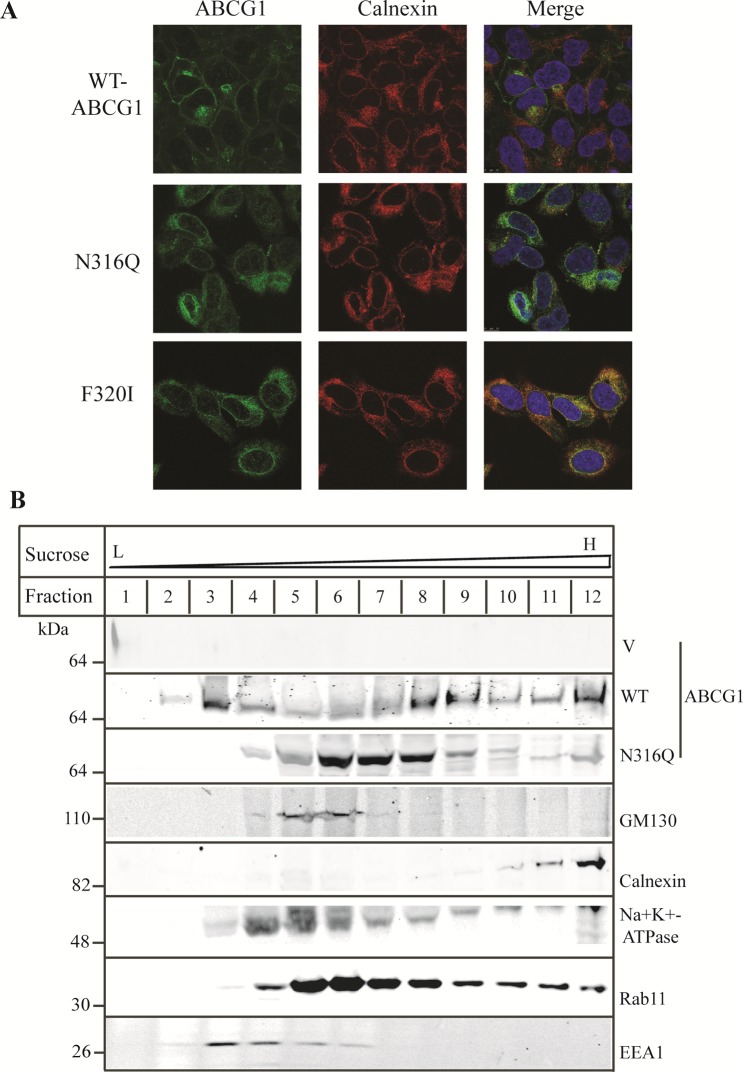
Figure 6.
Effect of mutations N316Q and F320I on ABCG1 trafficking. Panel A: Immunofluorescence of wild type and mutant ABCG1. The experiment was performed as described in the legend to Figure 4A. ABCG1 was detected with H-65 and indicated in green. Nuclei were stained with DAPI and shown in blue. The ER marker, calnexin, was shown in red (magnification: 100×). Panel B: Cell fractionation of wild type and mutant ABCG1. Cell lysates were fractionated as described in Materials and Methods. Briefly, HEK293 cells stably expressing wild type or mutant ABCG1 were disrupted by incubation with ice-cold, low ionic strength buffer C followed by homogenization with a Dounce homogenizer. The homogenates were made isotonic and centrifuged. The supernatant was loaded on top of linear sucrose gradient (10%–40%) and then subjected to centrifugation. After that, 1 mL fractions were collected from the top to the bottom of the gradient, precipitated with TCA, and subjected to SDS-PAGE (8–20%). After electro-transferring, the membranes were cut into halves between the 40 kDa and 30 kDa protein standards. The top membranes were blotted with a polyclonal antibody, 4497, and a monoclonal anti-GM130 antibody or with a polyclonal anticalnexin and a monoclonal anti-Na+K+-ATPase antibody. The bottom membranes were blotted with a monoclonal anti-EEA1 or a monoclonal anti-Rab11 antibody. Similar results were obtained from one more independent experiment.

