Figure 4.
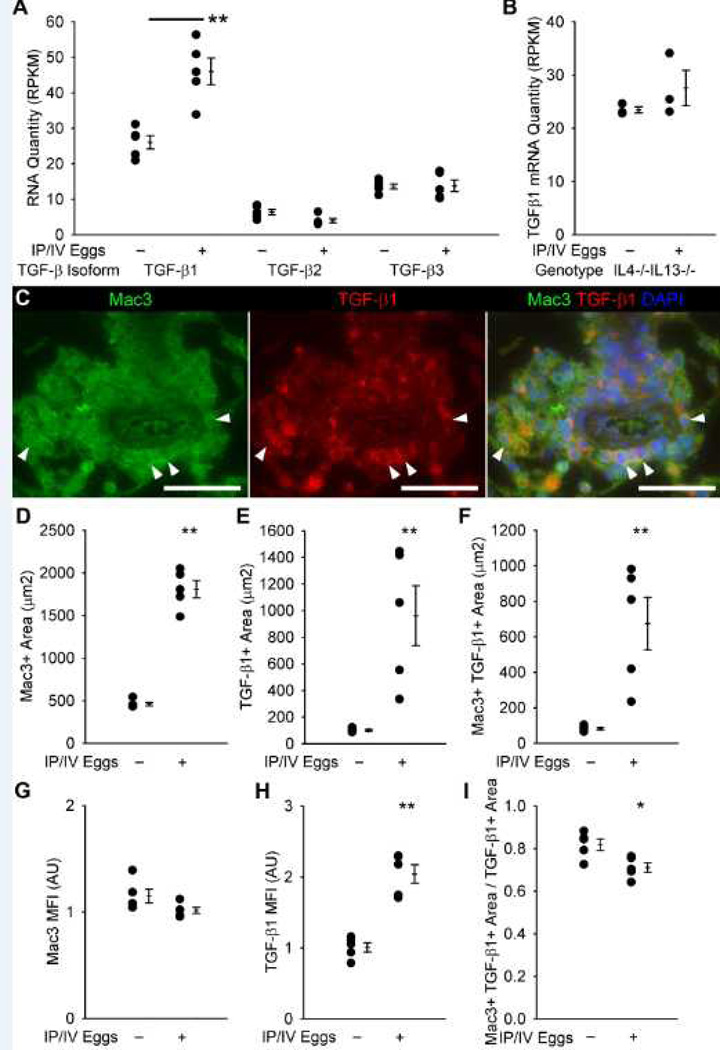
TGF-β mRNA expression and protein co-localization with antibodies targeting Mac3 (a macrophage marker). (A) TGF-β1, 2 and 3 isoform mRNA quantities in wildtype unexposed and egg-exposed mice (RPKM: reads per kilobase of exon model per million mapped reads; mean ± SE; n = 5 mice per group; rank-sum test **P<0.01). (B) TGF-β1 mRNA quantities in IL4−/−IL13−/− unexposed and egg-exposed mice (mean ± SE; n = 3 mice per group; rank-sum test P=0.20). (C) Representative images showing Mac3 and TGF-β1 co-localization in the adventitia of an IP/IV S. mansoni egg-exposed mouse (Arrowheads mark double-positive cells; Scale bars: 50 µm). (D–F) Quantification of Mac3+, TGF-β1+, and Mac3+ and TGF-β1+ co-localized areas in the adventitia (mean ± SE; n = 5 mice per group; rank-sum test **P<0.01). (G–H) Mean fluorescent intensity of Mac3+ and TGF-β1+ pixels (arbitrary units; normalized to average of uninfected adventitia = 1; mean ± SE; n = 5 mice per group; rank-sum test **P<0.01; P=0.056 for Mac3 intensity). (I) Ratio of co-localized Mac3+ and TGF-β1+ area to all TGF-β1+ area in the adventitia (mean ± SE; n = 5 mice per group; rank-sum test *P<0.05).

