
Figure 1.
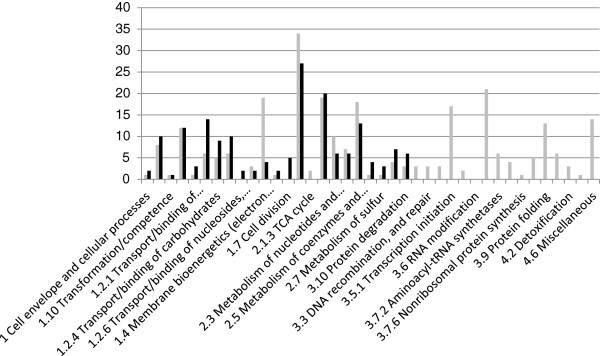
Number of induced and repressed genes in the colonic environment, compared to spent medium, classified by metabolic function. In grey and in black: induced and repressed genes, respectively. Differential comparisons between groups were performed gene by gene using a modified t-test. Genes were declared as differentially expressed (DE) with a P value ≤ 0.001 and |fold change| > 2.