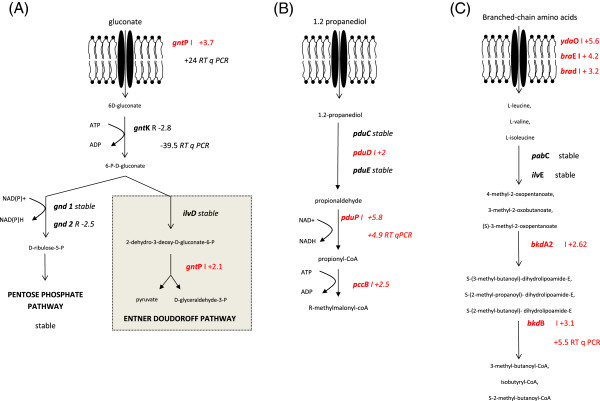
Figure 2.
Induction of gluconate, propanediol and branched-chain amino acid degradation pathway in the colonic environment compared to spent medium. (A) Induction of gluconate degradation pathway in the colonic environment compared to spent medium. I and R indicate induced and repressed genes in the colonic environment, compared to spent medium, followed by the fold change based on a mean of four repetitions of microarray data. Differential comparisons between groups were performed gene by gene using modified t-test. Genes were declared as differentially expressed with a p-value ≤ 0.001 and |fold change| > 2. Three repetitions of RT-qPCR were performed and genes were declared as DE with a Student test P value < 0.05. (B) Induction of propanediol degradation in the colonic environment, compared to spent medium. Differential comparisons between groups were performed gene by gene using modified t-test. Genes were declared as differentially expressed with a P value ≤ 0.001 and |fold change| > 2. R indicates a repression. I indicates an induction. Numbers indicate the fold change based of a mean of four repetitions for microarray data. Three repetitions of RT-qPCR were performed and genes were declared as DE with a Student test p-value < 0.05. (C) Pathway of amino acid catabolism induced in the colonic environment, compared to spent medium. Differential comparisons between groups were performed gene by gene using a modified t-test. Genes were declared as differentially expressed with a P value ≤ 0.001 and |fold change| > 2. I indicates an induction. Numbers indicates the fold change based on a mean of four repetitions for microarray data. Three repetitions for RT-qPCR were performed and genes were declared as differentially expressed with Student test p-value < 0.05.

