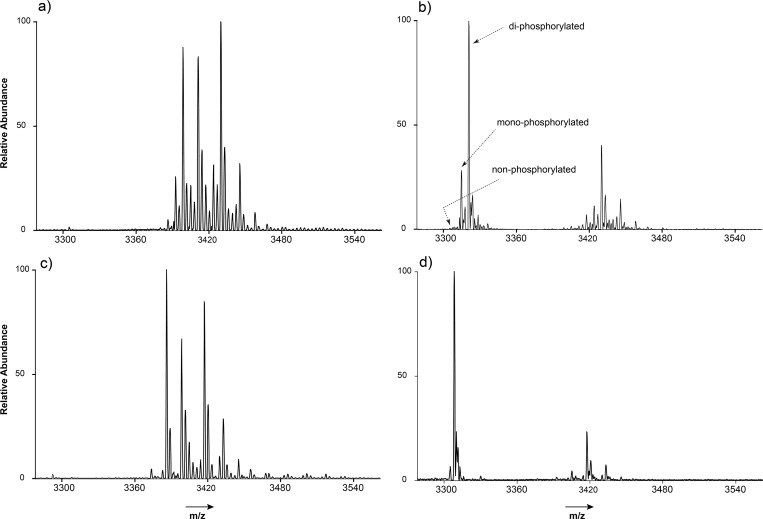
Figure 2.
Zoom in on the [M + 13H]13+ charge state, native ESI-MS spectra of (a) unprocessed, (b) deglycosylated, (c) dephosphorylated, and (d) deglycosylated and dephosphorylated ovalbumin. From a comparison of the spectra in (b) and (d), the two phosphorylation sites could be confirmed. The average mass of the “naked” ovalbumin polypeptide backbone (with N-acetylation, and one GlcNAc) determined from the spectrum (d) is 42995.35 Da, within 1.23 ppm of the expected mass (42995.29 Da). The abundance ratio between the maximum and minimum detectable and assigned proteoforms is ∼800.

