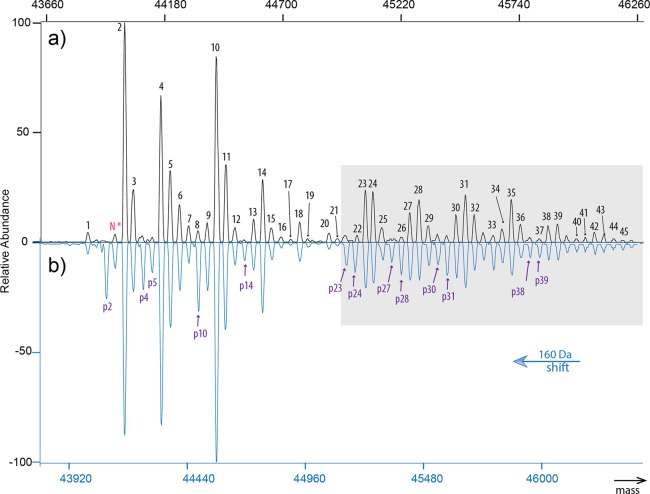
Figure 3.
Characterization of 59 proteoforms in chicken ovalbumin. (a) Variations caused by the widespread glycosylation could be most easily identified and assigned using the spectrum of dephosphorylated ovalbumin. By comparing this spectrum in (a) to unprocessed ovalbumin in (b), proteoforms with either one or two phosphorylation sites occupied could be detected (with the single phosphorylated peaks annotated in purple). The proteoform lacking N-terminal acetylation is marked as N* in pink. The signals in the gray box are multiplied by a factor of 10 and highly enriched in the less reported glycan structures. We hypothesize that several of the complex-type glycans in the composition range 24–45 are in fact extensions of the well-established complex-type glycans from the composition range 1–23, namely, with terminal Gal(α1–4)Gal and polylactosamine units, in separated or mixed form.

