
Fig. 1.
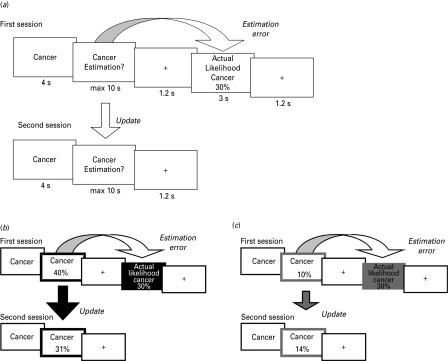
Paradigm. (a) On each trial participants were presented with a short description of one of 70 adverse life events and asked to estimate how likely this event was to occur to them in their lifetime. They were then presented with the average probability of that event occurring to a person living in the same sociocultural environment. The second session was the same as the first session, except that the average probability of the event occurring was not presented again. For each event an update term was calculated as the difference between the participants' first and second estimations. (b,c) Examples of trials for which the participant's estimate was (b) higher or (c) lower than the average probability. Here, for illustration purposes, the thick black and gray frames denote the participant's response (either an overestimation or an underestimation respectively). The black and gray filled boxes denote information that calls for an adjustment in (b) a desirable (optimistic) or (c) an undesirable (pessimistic) direction.