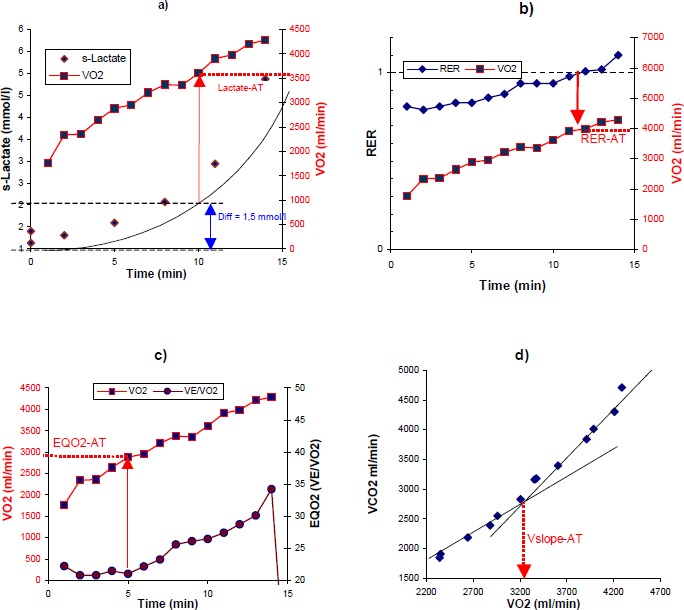
Figure 1.

Examples showing methods of estimating the anaerobic threshold, see material and methods for detail. a) Lactate-AT is the point where the trend line for s-lactate exceeds pretest level + 1.5 mmol·l-1. b) RER-AT is the point where RER exceeds 1.0. c) EQ-AT is where EQO2 (VE/VO2) is at the minimum before it starts rising under exercise. d) Vslope-AT is the crossing point between the regression lines for VO2 plotted against VCO2 during first part of the exercise and during the last part of the exercise.
