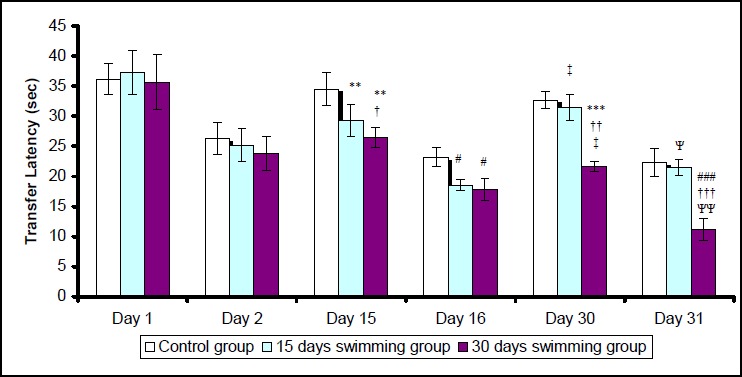
Figure 2.

Effect of swimming on Transfer-Latency (TL) of mice using Elevated Plus Maze. Values represent mean (± SEM).
** and *** denote p < 0.01 and 0.001, respectively, compared with 1st day in same group.
# and ### denote p < 0.05 and 0.001, respectively, compared with 2nd day in same group.
†, †† and ††† denote p < 0.05, 0.01 and 0.001, respectively, compared with control group on same day.
‡ denotes p < 0.05 compared with 15th day in same group.
Ψ and ΨΨ denote p < 0.05 and 0.01, respectively, compared with 16th day in same group.
