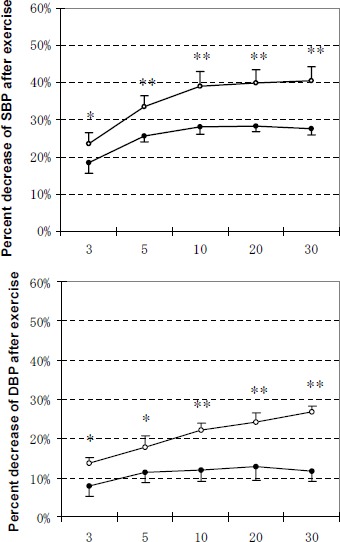
Figure 2.

Decrease in SBP and DBP at 3 min, 5 min, 10 min, 20 min and 30 min after exercise as a percentage of peak BP. Data are means (±SE). Relative decrease of BP at time T after exercise as a percentage of peak BP: (peak BP - BPT) / peak BP x 100, where T = 3 min, 5 min, 10 min, 20 min or 30 min. Open and solid circles represent the values for M group and C group, respectively. *, ** Significantly different between M group and C group (* p < 0.05, ** p < 0.01).
