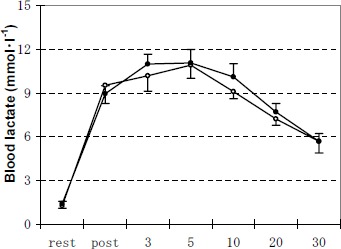
Figure 3.

Changes of blood lactate concentration during the experiments of rest, immediately after exercise, 3 min, 5 min, 10 min, 20 min and 30 min after exercise. Data are means (±SE). Open and solid circles represent the values for M group and C group, respectively.
