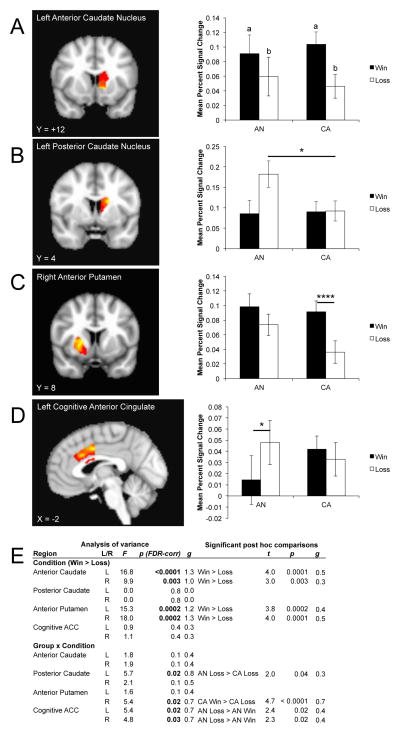
Figure 3.
Anatomical location and mean percent signal change for executive regions of interest demonstrating either a main effect of condition or a group x condition interaction. A) Left anterior caudate nucleus; B) left posterior caudate nucleus; C) right anterior putamen; D) left cognitive anterior cingulate cortex. Hot colors indicate voxels reflecting a greater response to wins relative to losses (or the group x condition interaction if the main effect of condition was not significant) within the regions of interest. E) Table of significant analysis of variance main effects, interactions, and post hoc comparisons. Where different, lowercase letters on the barplot indicate a significant difference of mean percent signal for the main effect of win > loss. AN: ill adolescent females with anorexia nervosa; CA: control adolescent females; FDR: false discovery rate. *p < 0.05; ****p < 0.0001

