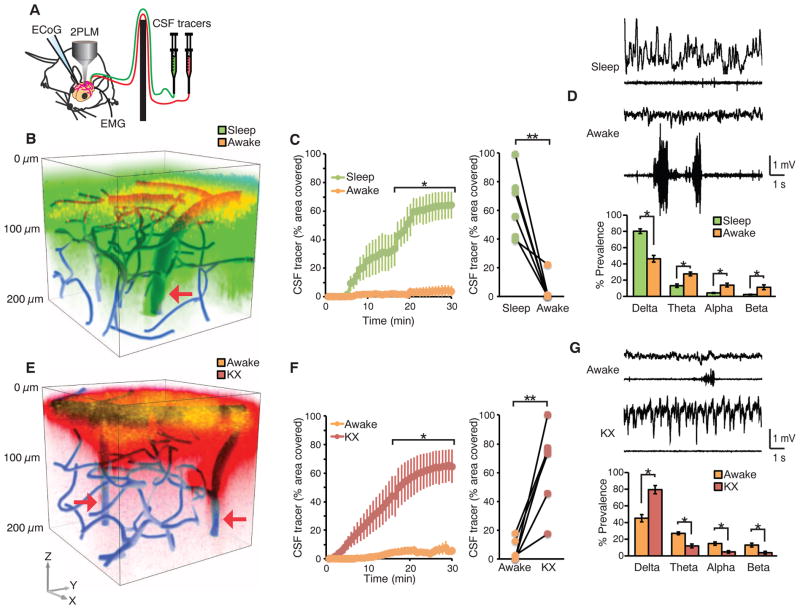
Fig. 1. Wakefulness suppresses influx of CSF tracers.
(A) Diagram of experimental setup used for two-photon imaging of CSF tracer movement in real time. To avoid disturbing the state of brain activity, a cannula with dual ports was implanted in the cisterna magna for injection of CSF tracers. ECoG and EMG were recorded to monitor the state of brain activity. (B) Three-dimensional (3D) vectorized reconstruction of the distribution of CSF tracers injected in a sleeping mouse and then again after the mouse was awakened. The vasculature was visualized by means of cascade blue-dextran administered via the femoral vein. FITC-dextran (green) was first injected in the cisterna magna in a sleeping mouse and visualized by collecting repeated stacks of z-steps. Thirty min later, the mouse was awakened by gently moving its tail, and Texas red-dextran (red) was administered 15 min later. The experiments were performed mostly asleep (12 to 2 p.m.). The arrow points to penetrating arteries. (C) Comparison of time-dependent CSF influx in sleep versus awake. Tracer influx was quantified 100 μm below the cortical surface; n = 6 mice; *P < 0.05, two-way ANOVA with Bonferroni test. (Right) The tracer intensity within the two arousal states at the 30-min time point was compared. **P < 0.01, t test. (D) ECoG and EMG recordings acquired during sleep and after the mouse was awakened. Power spectrum analysis of all the animals analyzed in the two arousal states (n = 6 mice; *P < 0.05, t test). (E) 3D reconstruction of CSF tracer influx into the mouse cortex. FITC-dextran was first injected in the awake stage, and cortical influx was visualized by means of two-photon excitation for 30 min. The mouse was then anesthetized with ketamine/xylazine (intraperitoneally), and Texas red-dextran was injected intra-cisternally 15 min later. The vasculature was visualized by means of cascade blue-dextran. Arrows point to penetrating arteries. (F) Comparison of time-dependent CSF influx in awake versus ketamine/xylazine anesthesia; n = 6 mice; *P < 0.05, two-way ANOVA with Bonferroni test. (Right) The tracer intensity during the two arousal states at the 30-min time point was compared. **P < 0.01, t test. (G) ECoG and EMG recordings in the awake mouse and after administration of ketamine/xylazine. Power spectrum analysis of all the animals analyzed in the two arousal states; n = 6 mice; *P < 0.05, t test.

