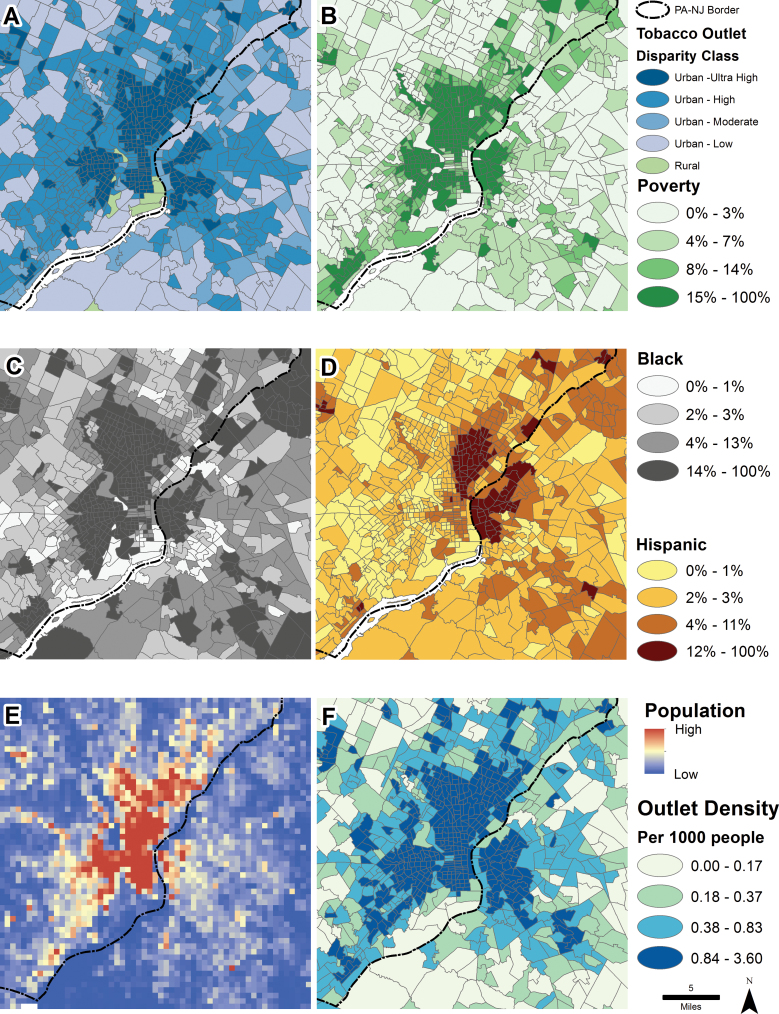
Figure 1.
Visual comparison of latent classes and related socio-demographic variables in the greater Philadelphia, PA/Camden, NJ, area. All maps except (E) show census tract boundaries, and all except (A) and (E) are categorized in quartiles. (A) illustrates the three disparity classes, (B) the percentage of families with income below the poverty level, (C) the percentage of Blacks, (D) the percentage of Hispanics, (E) shows population counts and the settlement pattern using the LandScan™ Global Population Data Set (Oak Ridge National Laboratory), and (F) is a map of tobacco outlet density categorized in quartiles.

