Table 2.
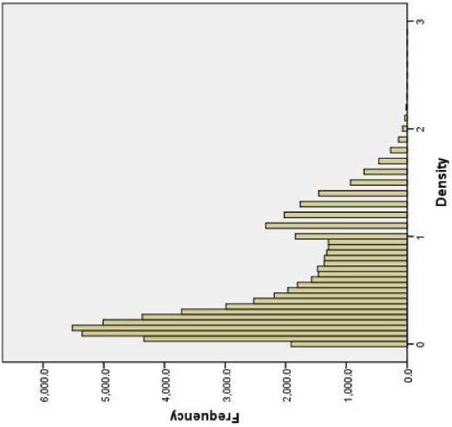
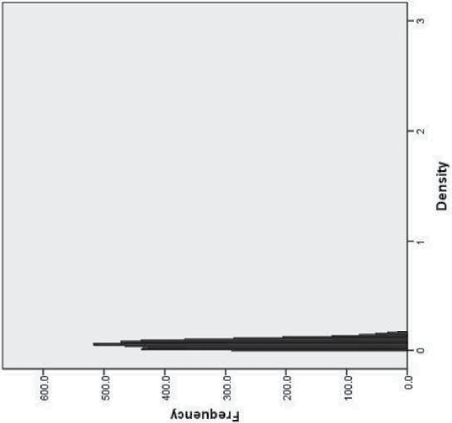
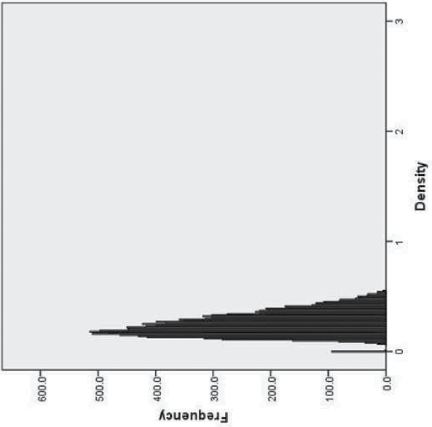
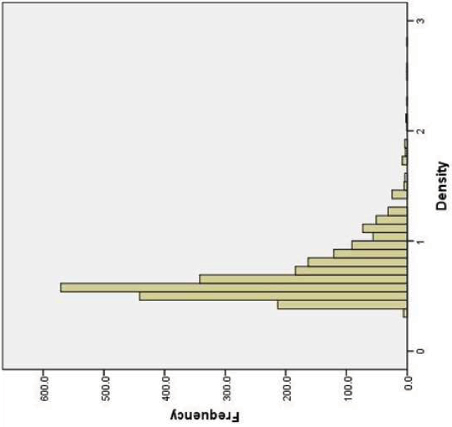
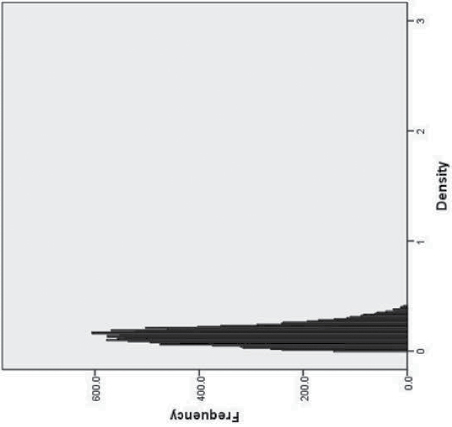
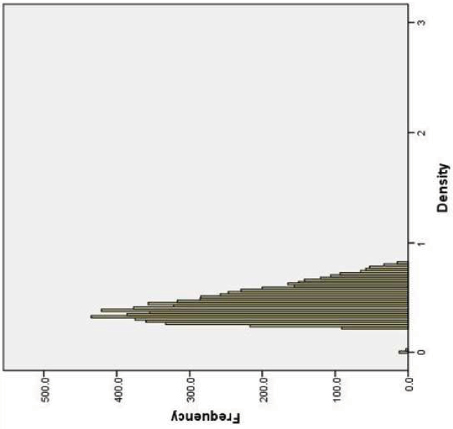
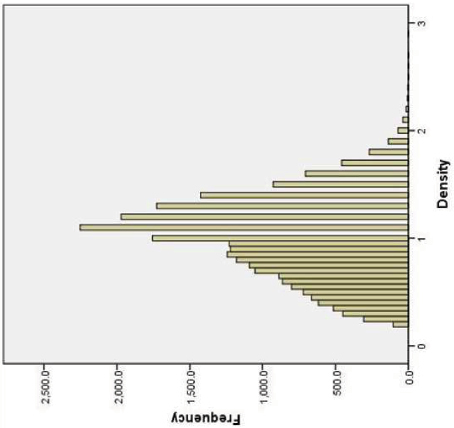
Mean Tobacco Outlet Density and Proportions of Families Living in Poverty, Blacks, and Hispanics per Census Tract for the Entire Sample and Divided by Latent Disparity Class, With Accompanying Density Histograms
| Urban/rural | Disparity class | Tracts | Density | % Hispanic | % Black | % Poverty | |||||
|---|---|---|---|---|---|---|---|---|---|---|---|
| M | SD | M | SD | M | SD | M | SD | ||||
|
Overall | 64863 | .52 | .45 | .12 | .19 | .14 | .24 | .10 | .10 | |
|
Rural | Low | 5623 | .06 | .04 | .06 | .13 | .06 | .13 | .09 | .08 |
|
Rural | Moderate | 12203 | .25 | .10 | .05 | .11 | .08 | .15 | .10 | .07 |
|
Rural | High | 2402 | .69 | .27 | .09 | .18 | .09 | .19 | .12 | .09 |
|
Urban | Low | 12915 | .15 | .08 | .08 | .14 | .11 | .19 | .07 | .08 |
|
Urban | Moderate | 7022 | .44 | .14 | .15 | .20 | .18 | .25 | .12 | .11 |
|
Urban | High | 24698 | .97 | .38 | .17 | .23 | .20 | .29 | .12 | .13 |
