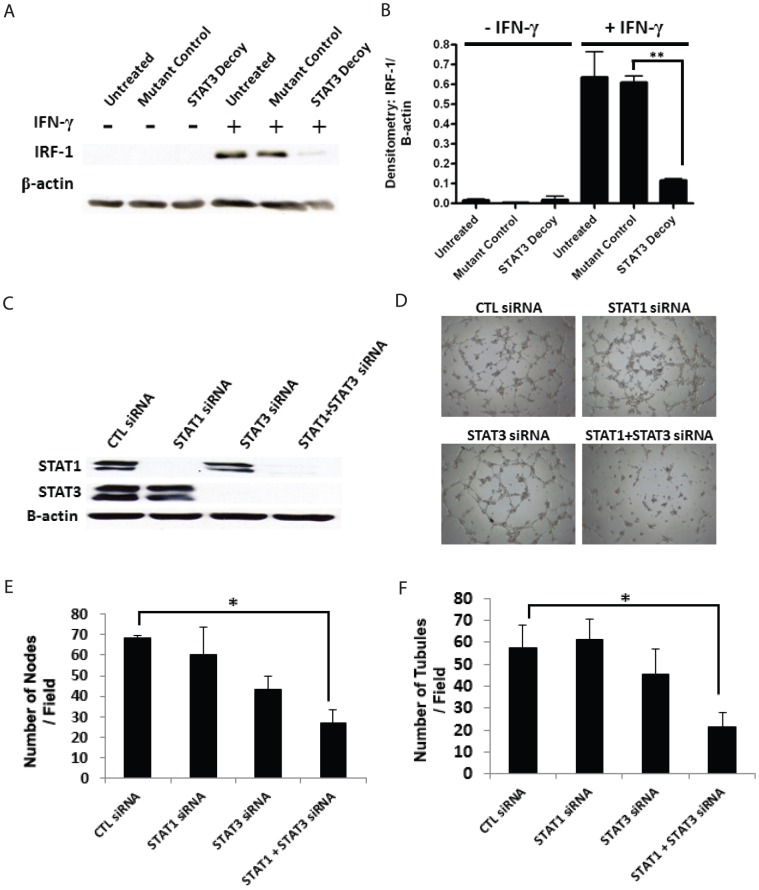
Figure 4. STAT3 decoy has additionally activity against STAT1.
(A) HUVECs were transfected with 100 nM of STAT3 decoy oligonucleotide. Twenty four hour after transfection, the cells were stimulated with IFN-γ (20 ng/ml for one hr) and Western blot was performed for IRF-1. (B) Densitometric measurement of IRF-1 (** P<0.05). (C) HUVECs were transfected with either STAT1 siRNA, STAT3 siRNA or both. Western blot was then performed to confirm the downregulation of STAT1, STAT3, or both. (D) Downregulation of STAT1 or STAT3 did not result in decreased tubule formation. In contrast, combined downregulation of both STAT1 and STAT3 resulted in statistically significant decrease in tubule formation. Quantification of tubule formation by (E) total number of nodes per field and (F) total number of tubules per field (* p<0.05).

