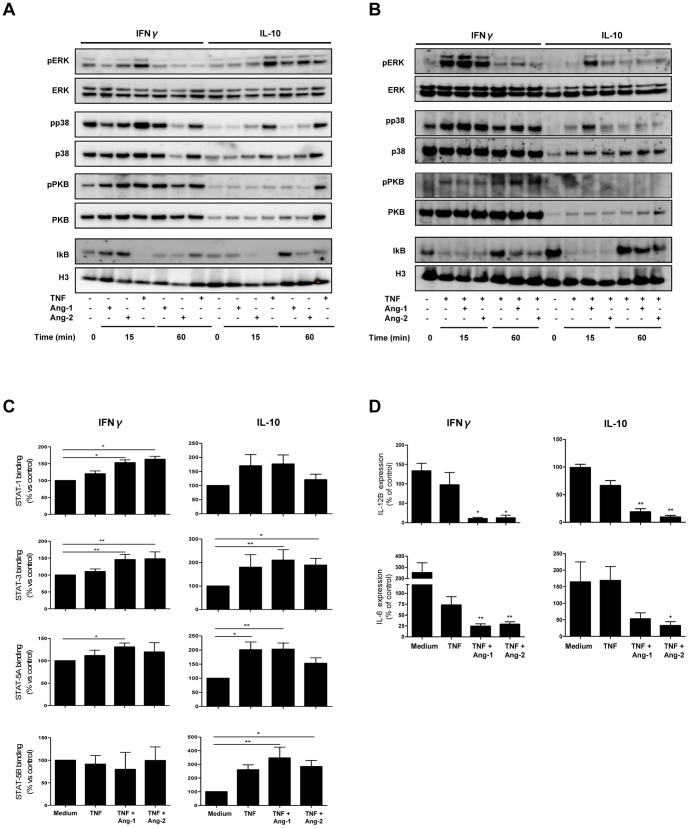
Figure 7. Ang-1 and Ang-2 enhance TNF-induced activation of macrophages via JAK/STAT signaling.
(A) Immunoblot analyses of cellular lysates obtained from IFN-γ or IL-10 differentiated macrophages stimulated for the indicated times (minutes) with TNF (10 ng/ml), Ang-1 (200 ng/ml) or Ang-2 (200 ng/ml) for expression and phosphorylation (p) of the indicated signaling proteins. All data shown are from independent immunoblots performed on macrophage lysates obtained from a single donor and are representative of 4 individual experiments. (B) Immunoblot analyses of cellular lysates obtained from IFN-γ or IL-10 differentiated macrophages stimulated for the indicated times (minutes) with TNF (10 ng/ml) in the presence or absence of Ang-1 (200 ng/ml) or Ang-2 (200 ng/ml) for expression and phosphorylation (p) of the indicated signaling proteins. All data shown are from independent immunoblots performed on macrophage lysates obtained from a single donor and are representative of 4 individual experiments. (C) STAT family DNA-binding activity in nuclear lysates obtained from macrophages stimulated for 2 h with TNF (10 ng/ml) in the absence or presence of Ang-1 (200 ng/ml) or Ang-2 (200 ng/ml). Bars represent the means and SEM of 4 independent experiments. *P<0.05, **P<0.01. Friedman test was used for statistical analyses. (D) IL12B (upper panels) and IL6 mRNA (lower panels) expression levels in IFN-γ (left panels) and IL-10 –differentiated macrophages (right panels) after stimulation with medium alone or TNF (10 ng/ml) in the absence or presence of Ang-1 (200 ng/ml) or Ang-2 (200 ng/ml), in the presence or absence of AG490 (10 µM). Values in are represented as percentage mRNA expression in the presence of AG490 in the defined conditions relative to expression in the absence of the inhibitor. Bars represent the means and SEM of 5 independent experiments. *P<0.05, **P<0.01. Friedman test was used for statistical analyses.

