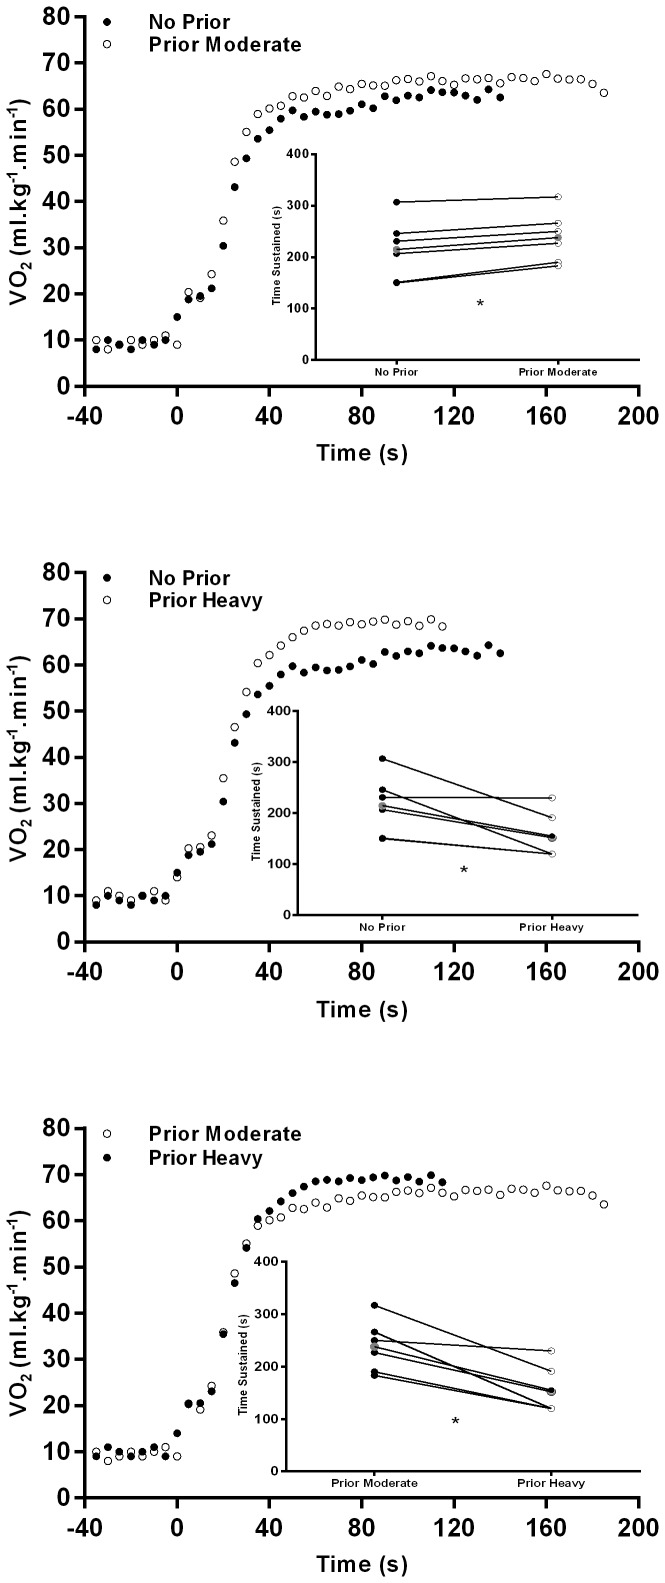
Figure 2. VO2 dynamic response of one subject performing time to exhaustion exercise bouts.
After no prior exercise (closed circles) and after prior moderate exercise (open circles) (upper panel); after no prior exercise (closed circles) and after prior heavy exercise (open circles) (middle panel); after prior moderate exercise (closed circles) and after prior heavy exercise (open circles) (lower panel). The insets in the respective VO2 graphs represent the individual (full black and full white) and mean (full grey) values in the time sustained at the correspondent exercise bout released. *significant differences between the two studied conditions (p<0.05).

