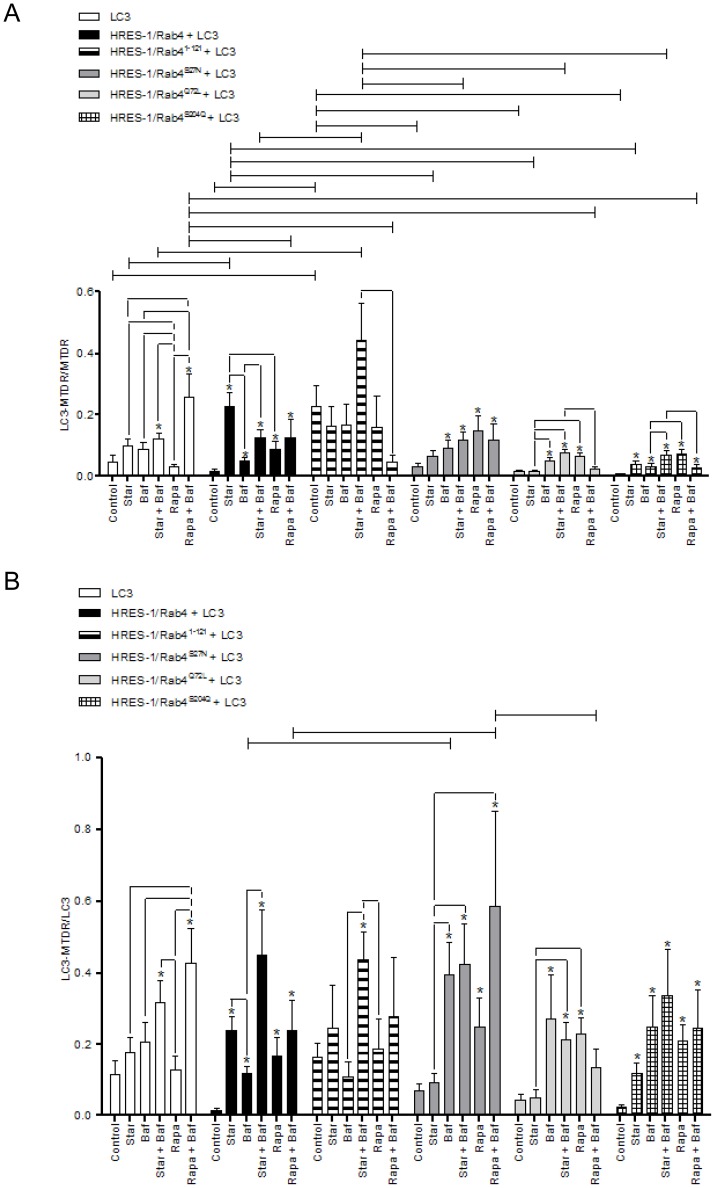
Figure 5. Quantitative analysis of colocalization between LC3+ autophagosomes and mitochondria in HeLa cells transfected with eGFP-tagged HRES-1/Rab4 isoforms and FP650-LC3.
Autophagy was induced by starvation (Star) or treatment with rapamycin (Rapa) in the presence or absence of bafilomycin A1 (Baf). A, Colocalization of FP-650 LC3 and MTDR-stained mitochondria relative to the total mitochondrial pool. B, Colocalization of FP-650 LC3 and MTDR-stained mitochondria relative to the total LC3 pool. Data represent mean ± SEM of 6–30 cells acquired in 3 independent experiments. * indicates p values<0.05 reflecting comparison to control cells among cell cultures transfected with the same construct using paired two-tailed t-tests; brackets connecting bars within each construct also reflect comparison with paired two-tailed t-tests. Brackets connecting bars between constructs reflect p<0.05 using ANOVA followed by Bonferroni's post-test.

