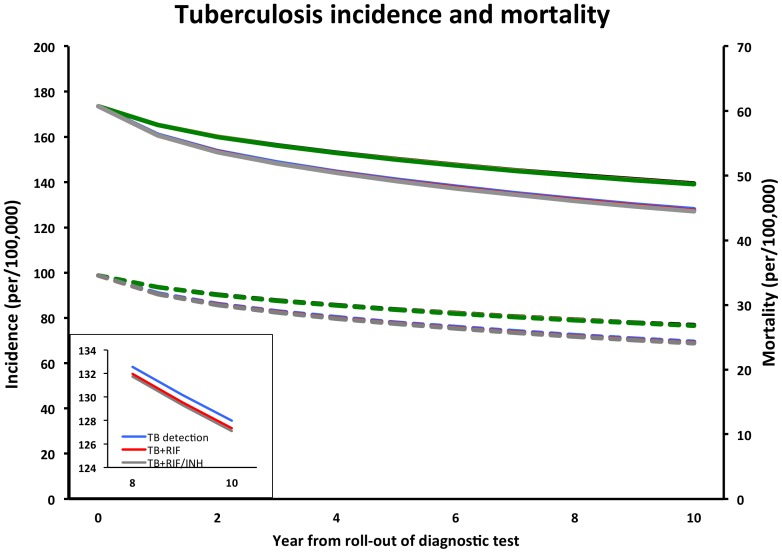
Figure 2. Impact of resistance testing on incidence and mortality.
Trajectory of overall TB incidence (solid lines, left axis) and mortality (dotted lines, right axis) over 10 years with introduction of a molecular test for diagnosis and detection of rifampin (RIF) resistance, with or without a molecular test for isoniazid (INH) resistance. Grey lines correspond to the high-coverage scenario (i.e. 50%, 80% and 100% coverage among new, previously treated and failure cases, respectively, excluding those with no access to care), green lines to an alternative lower-coverage scenario (15%, 25%, and 30% among new, previously treated and failure). The curves for TB+RIF versus TB+RIF/INH are indistinguishable on the graph because the projected outcomes are so similar (see inset with incidence from year 8–10 for high coverage scenarios).

