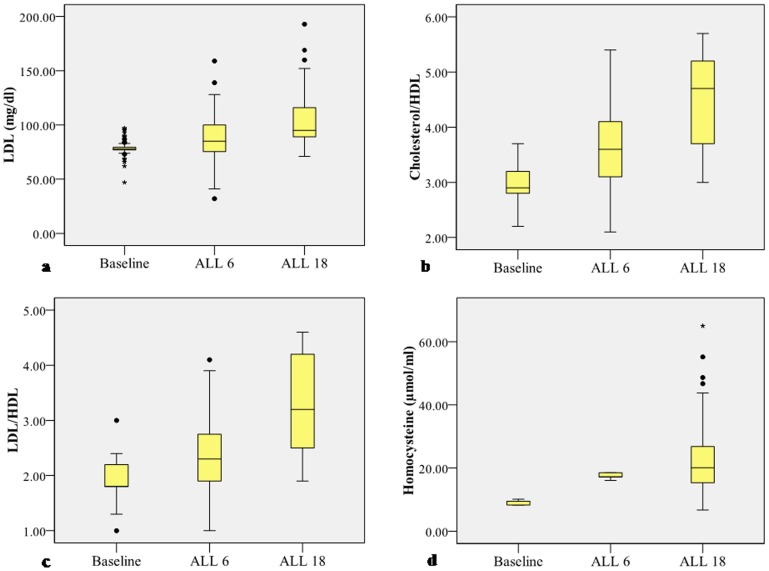
Figure 2. Graphic representation of serum coronary risk factor profile in baseline and follow up groups.
The limits of the boxes represent the middle 50% of the data values; the extent of the lines encompass the interquartile range with extreme outlying data points shown as such. The central line within each box represents the median. a. Serum LDL concentration is significantly elevated in ALL 18 (P<0.05) vs Baseline. b. Serum cholesterol/HDL ratio is significantly elevated in ALL 18 (P<0.05) vs Baseline. c. Serum LDL/HDL ratio is significantly elevated in ALL 18 (P<0.05) vs Baseline. d. Serum homocysteine concentration is significantly elevated in ALL 18 (P<0.05) vs Baseline.

