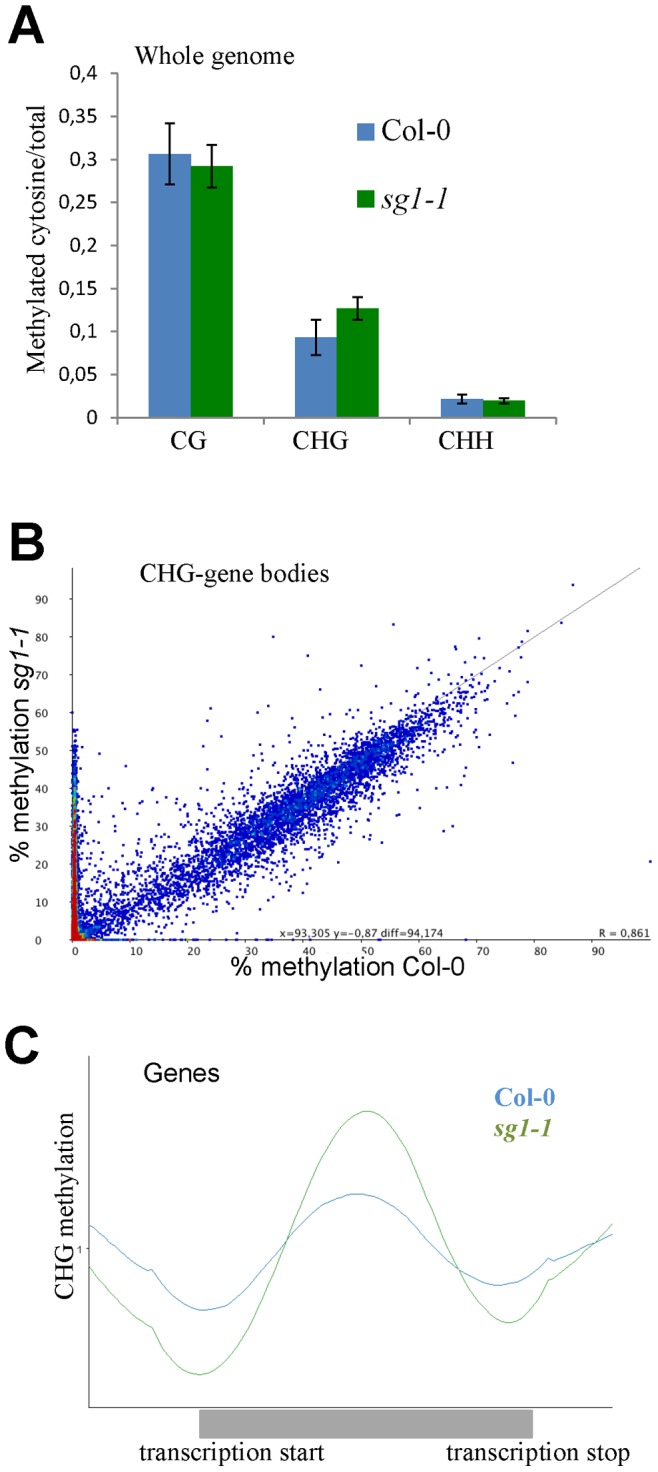
Figure 2. sg1-1 methylome analysis.

(A) Whole genome analysis of cytosine methylated in all three contexts of methylation (CG, CHG and CHH) in Col-0 and sg1-1 mutants. Error bars indicate the SD between two biological replicates. (B) Scatter plot representing the percentage of CHG methylation calculated for each gene in sg1-1 and Col-0. Hypermethylated genes in sg1-1 are visualized by the dense red area. (C) Graphic representation of the average distribution of CHG methylation in gene bodies.
