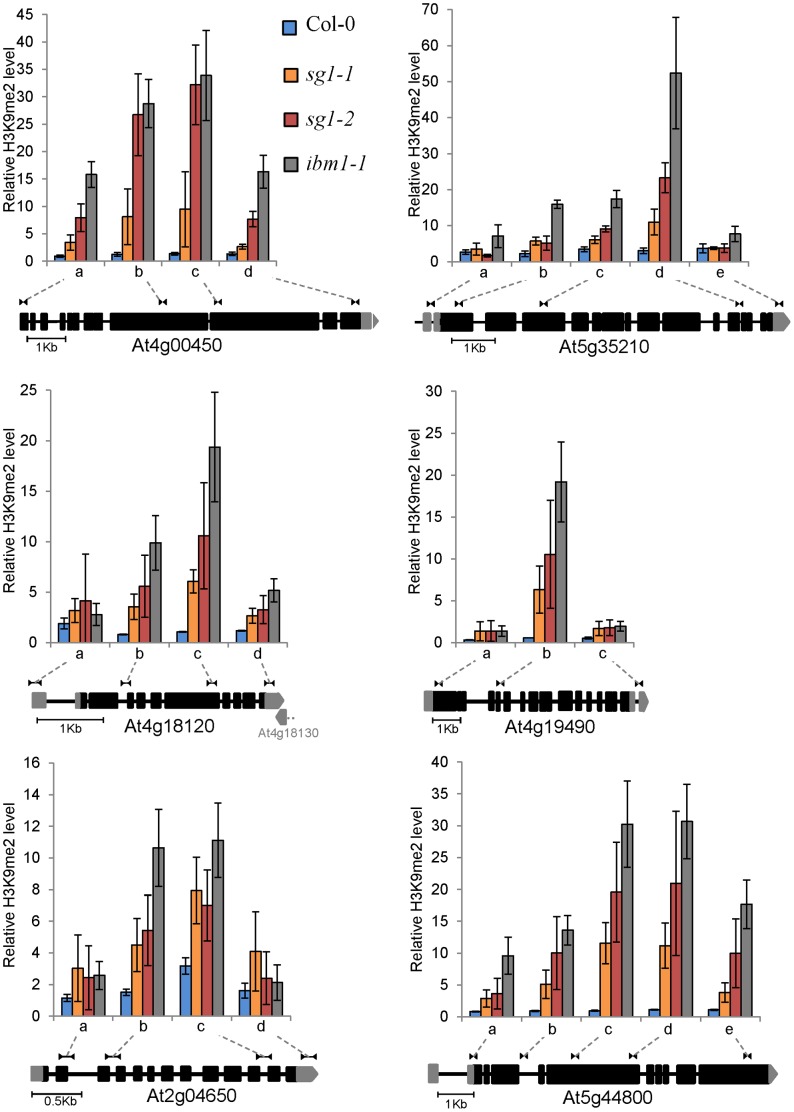
Figure 5. Gene-body H3K9me2 accumulation in sg1-1 and ibm1 mutants.
H3K9me2 profile across six genes mentioned in Figure 3, in WT Col-0, sg1-1, sg1-2 and ibm1-1 plants. The correspondence of genomic regions tested by ChIP is shown on a gene schematic based on TAIR v10. Error bars are SEM from at least three biological replicates.

