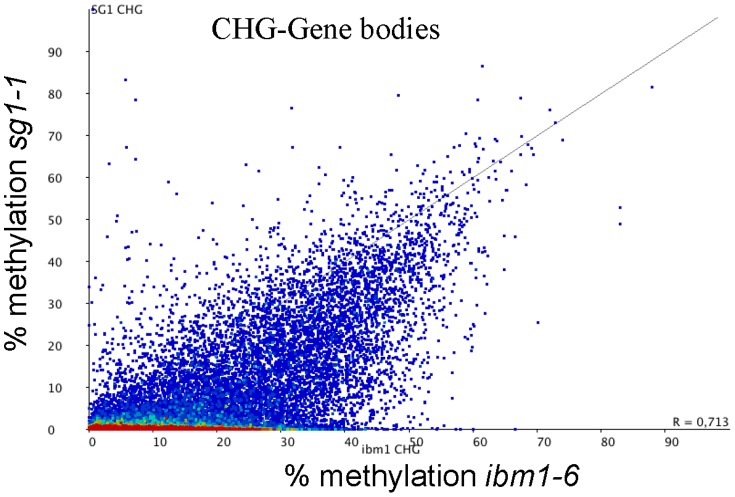
Figure 6. Comparison of sg1-1 and ibm1-6 CHG methylated genes.
Scatter plot representing the percentage of CHG methylation calculated for each gene in sg1-1 and ibm1-6, according to the data publicly available [16]. Genes solely methylated in ibm1 are visualised by the dense red area.

