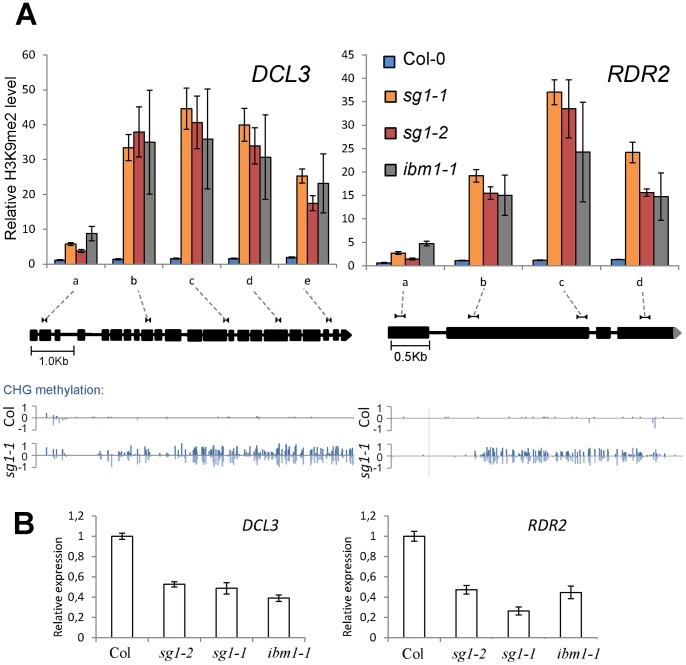
Figure 8. sg1 and key players of the RdDM pathway.
(A) H3K9me2 profile across RDR2 and DCL3 genes in WT Col-0, sg1-1, sg1-2 and ibm1-1 plants. The correspondence of genomic regions tested by ChIP is shown on a gene schematic based on TAIR v10; CHG methylation is presented below. Error bars are SEM from at least three biological replicates. (B) Transcript accumulation of RDR2 and DCL3 in sg1 and ibm1 determined by qPCR analyses. Error bars are SEM from three replicates.

