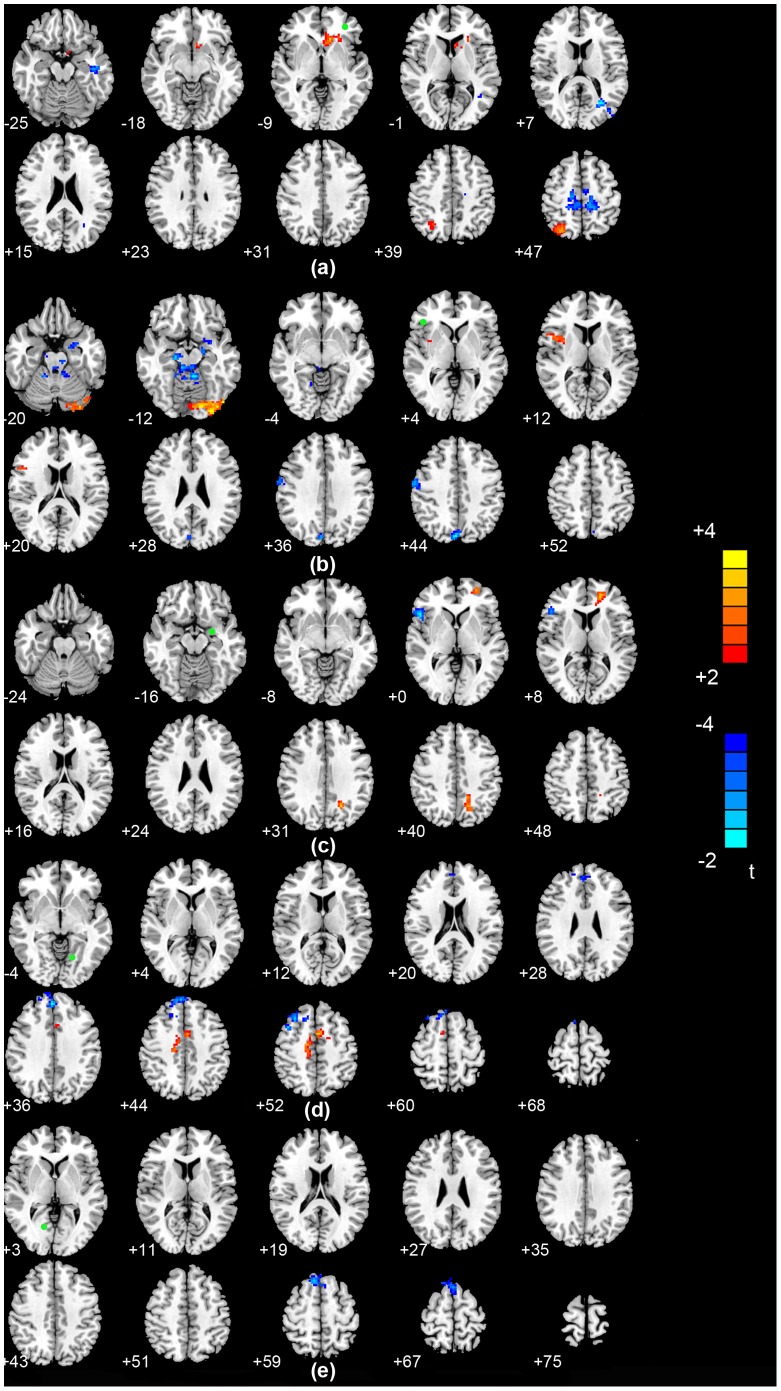
Figure 2. Statistical parametric map showing the significant differences of functional connectivity between PDD and nD-PD groups.
(a) Differences in functional connectivity for the left middle frontal gyrus seeds between the PDD and nD-PD groups. (b) Differences in functional connectivity for the right inferior frontal gyrus between the PDD and nD-PD groups in the resting state. (c) Differences in functional connectivity for the left amygdala seeds between the PDD and nD-PD groups. (d) Differences in functional connectivity for left lingual gyrus seeds between the PDD and nD-PD groups. (e) Differences in functional connectivity for right lingual gyrus seeds between the PDD and nD-PD groups. T score bars are shown on the right. Green spot: the position of the region of interest.

