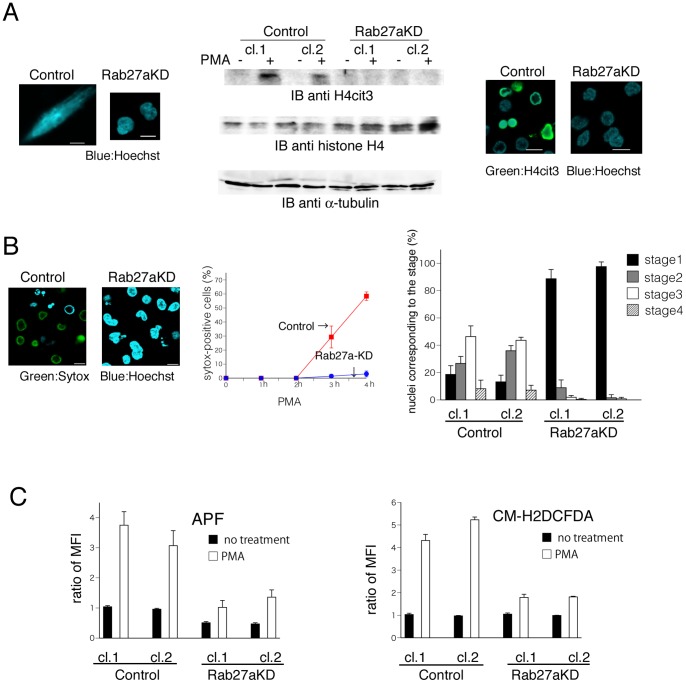
Figure 4. The effects of Rab27a-knockdown on PMA-induced NET formation.
(A–C) Neutrophil-like differentiated control HL60 cells (Control; clone 1 and clone 2) and Rab27a-knockdown cells (Rab27aKD; clone 1 and clone 2) were stimulated with PMA. (A) Both cells fixed with PFA were stained with Hoechst 33342 (left). Cell lysates were assesed by immunoblotting analysis using specific antibody against H4cit3 and histone H4 (middle). PFA-fixed cells were stained with antibody against H4cit3 in the presence of Hoechst 33342 (right). Scale bars indicate 10 µm. (B) Representative fluorescence images at 4 hours after PMA treatment in the presence of both Hoechst 33342 and Sytox Green. Scale bars indicate 10 µm. Blue and green colors show Hoechst 33342-positive and Sytox Green-positive, respectively (left). The results of Rab27aKD clone 1 and Control clone 1 are shown as representative data. Frequency of Sytox Green-positive cells at indicated time points after PMA treatment (middle). The percentage of the cells in the individual stages at 4 h after PMA treatment (right). (C) The mean fluorescence intensity (MFI) after PMA treatment in the presence of APF at 30 min (left) or CM-H2DCFDA at 20min (right). The mean value of MFI of control cells was adjusted to 1. In (B) and (C), the data are the mean with SD from three independent experiments.

