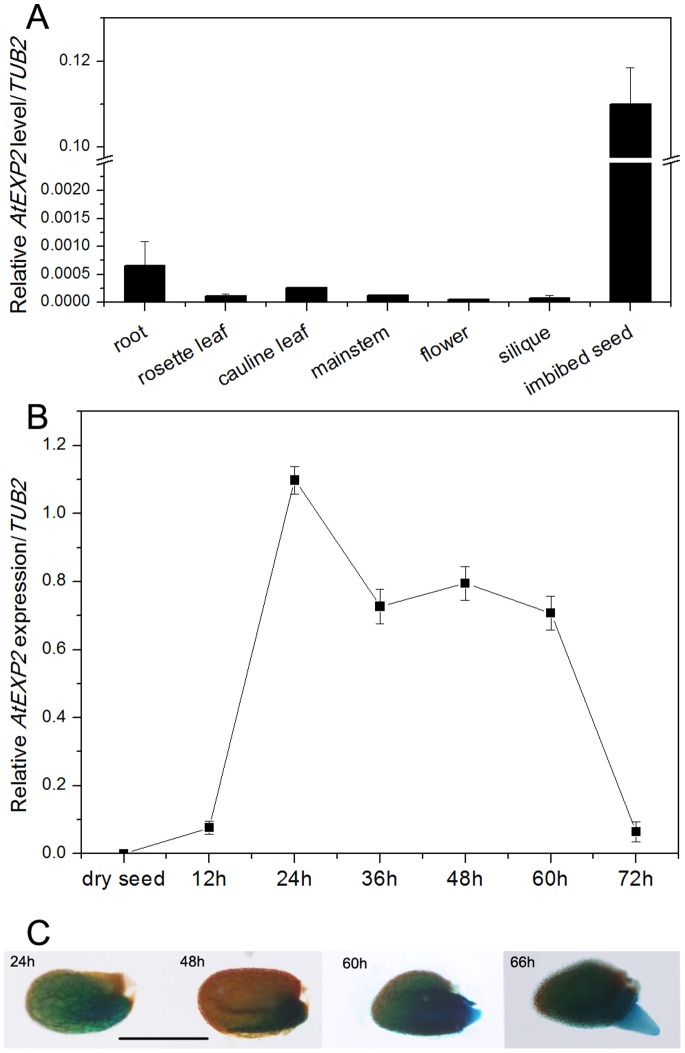
Figure 1. Expression pattern of AtEXP2 gene.
(A) Tissue-specific expression of AtEXP2. Various tissues of Arabidopsis wild type plants were harvested for RNA extraction. (B) Time course of AtEXP2 expression. Dry seeds and imbibed seeds of Col-0 were harvested for RNA extraction. Transcript levels of AtEXP2 were measured by real-time RT-PCR, and the values were normalized against the levels of TUB2 as a control. Error bars represent SD. (C) GUS staining in germinating seeds of the pAtEXP2:GUS transgenic line. Seeds from T3 homozygous plants of the pAtEXP2:GUS transgenic line were analyzed. Bar = 1 mm.

