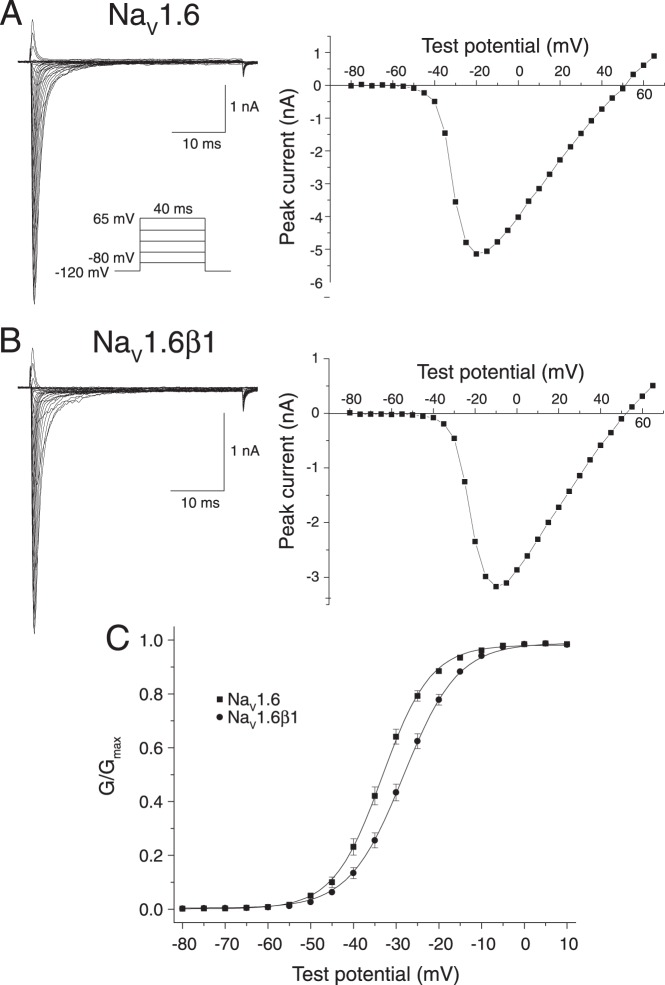
Figure 2. Voltage-dependent activation of Nav1.6 and Nav1.6β1 sodium channels expressed in HEK293 cells.
(A) Representative current traces recorded from a HEK-Nav1.6 cell using the indicated pulse protocol (left) and the plot of peak sodium current in these traces as a function of test potential (right). (B) Representative current traces recorded from a HEK-Nav1.6β1 cell using the pulse protocol shown in Panel A and the plot of peak sodium current in these traces as a function of test potential. (C) Conductance – voltage plots for the activation of Nav1.6 and Nav1.6β1 channels. Peak sodium currents such as those in Panels A and B were transformed to conductances (G) using the equation G = I/(Vt–Vrev), where I is the peak current, Vrev is the reversal potential, and Vt is the voltage of the test potential; conductances were then normalized to the maximum conductance (Gmax) for that cell. Values are means of 64 (Nav1.6) or 65 (Nav1.6β1) separate experiments with different cells; bars show SE values larger than the data point symbols. Curves were fitted to the mean values using the Boltzmann equation.

